Download

1 / 139
1.41k likes | 1.63k Views
Time Series and Forecasting. Random Series. STEREO.XLS. Monthly sales for a chain of stereo retailers are listed in this file.

E N D
Time Series and Forecasting Random Series
STEREO.XLS • Monthly sales for a chain of stereo retailers are listed in this file. • They cover the period form the beginning of 1995 to the end of 1998, during which there was no upward or downward trend in sales and no clear seasonal peaks or valleys. • This behavior is apparent in the time series chart of sales shown on the next slide. It is possible that this series is random. • Does a runs test support this conjecture?
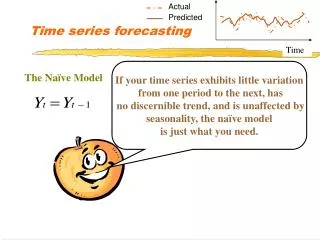
Random Model • The simplest time series is the random model. • In a random model the observations vary around a constant mean, have a common variance, and are probabilistically independent of one another. • How can we tell whether a time series is random? • There are several checks that can be done individually or in tandem. • The first of these is to plot the series on a control chart. If the series is random it should be “in control”.
Runs Test • The runs test is the second check for a random series. • A run is a consecutive sequence of 0’s and 1’s. • The runs test checks whether this is about the right number of runs for a random series.
Calculations • To do a runs test in Excel we use StatPro’s Runs Test procedure. • We must specify the time series variable (Sales) and the cutoff value for the test, which can be the mean, median or a user specified value. In this case we select the mean to obtain this sample of output.
Output • Note that StatPro adds two new variables, Sales_High and Sales_NewRun, as well as the elements for the test. • The values in the Sales_High are 1 or 0 depending on whether the corresponding sales value are above or below the mean. • The values in the Sales_NewRun column are also 1 or 0, depending on whether a new run starts in that month.
Output -- continued • The rest of the output is fairly straightforward. • We find the number of observations above the mean, number of runs, mean for the observed number of runs, the standard deviation for the observed number of runs and the Z-value. We then can find the two-sided p-value. • The output shows that there is some evidence of not enough runs. • The expected number of runs under randomness is 24.8333 and there are only 20 runs for this series.
Conclusion • The conclusion is that sales do not tend to “zigzag” as much as a random series - highs tend to follow highs and lows tend to follow lows - but the evidence in favor of nonrandomness is not overwhelming.
The Problem • The runs test on the stereo sales data suggests that the pattern of sales is not completely random. • Large values tend to follow large values, and small values tend to follow small values. • Do autocorrelations support this conclusion?
Autocorrelations • Recall that successive observations in a random series are probabilistically independent of one another. • Many time series violate this property and are instead autocorrelated. • The “auto” means that successive observations are correlated with one other. • To understand autocorrelations it is first necessary to understand what it means to lag a time series.
Autocorrelations • This concept is easy to understand in spreadsheets. • To lag by 1 month, we simply “push down” the series by one row. • Lags are simply previous observations, removed by a certain number of periods from the present time.
Solution • We use StatPro’s Autocorrelation procedure. • This procedure requires us to specify a time series variable (Sales), the number of lags we want (we chose 6), and whether we want a chart of the autocorrelations. This chart is called a correlogram. • How large is a “large” autocorrelation? • If the series is truly random, then only an occasional autocorrelation should be larger than two standard errors in magnitude.
Solution -- continued • Therefore, any autocorrelation that is larger than two standard errors in magnitude is worth our attention. • The only “large” autocorrelation for the sales data is the first, or lag 1, the autocorrelation is 0.3492. • The fact that it is positive indicates once again that there is some tendency for large sales values to follow large sales values and for small sales values to follow small sales values. • The autocorrelations are less than two standard errors in magnitude and can be considered “noise”.
DEMAND.XLS • The dollar demand for a certain class of parts at a local retail store has been recorded for 82 consecutive days. • This file contains the recorded data. • The store manager wants to forecast future demands. • In particular, he wants to know whether there is any significant time pattern to the historical demands or whether the series is essentially random.
Solution • A visual inspection of the time series graph shows that demands vary randomly around the sample mean of $247.54 (shown as the horizontal centerline). • The variance appears to be constant through time, and there are no obvious time series patterns. • To check formally whether this apparent randomness holds, we perform the runs test and calculate the first 10 autocorrelations. The numerical output and associated correlogram are shown on the next slides.
Solution -- continued • The p-value for the run test is relatively large, 0.118 - although these are somewhat more runs than expected - and none of the autocorrelations is significantly large. • These findings are consistent with randomness. For all practical purposes there is no time series pattern to these demand data. • The mean is $247.54 and the standard deviation is $47.78.
Solution -- continued • The manager might as well forecast that demand for any day in the future will be $247.54. If he does so about 95% of his forecast should be within two standard deviations (about $95) of the actual demands.
DOW.XLS • Given the monthly Dow Jones data in this file, check that it satisfies the assumptions of a random walk, and use the random walk model to forecast the value for April 1992.
Random Walk Model • Random series are sometimes building blocks for other time series models. • The random walk model is an example of this. • In the random walk model the series itself is not random. However, its differences - that is the changes from one period to the next - are random. • This type of behavior is typical of stock price data.
Solution • The Dow Jones series itself is not random, due to upward trend, so we form the differences in Column C with the formula =B7-B6 which is copied down column C. The difference can be seen on the next slide. • A graph of the differences (see graph following data) show the series to be a much more random series, varying around the mean difference 26.00. • The runs test appears in column H and shows that there is absolutely no evidence of nonrandom differences; the observed number of runs is almost identical to the expected number.
Solution -- continued • Similarly, the autocorrelations are all small except for a random “blip” at lag 11. • Because the values are 11 months apart we would tend to ignore this autocorrelation. • Assuming the random walk model is adequate, the forecast of April 1992 made in March 1992 is the observed March value, 3247.42, plus the mean difference, 26.00 or 3273.42. • A measure of the forecast accuracy is the standard deviation of 84.65. We can be 95% certain that our forecast will be within the standard deviations.
Additional Forecasting • If we wanted to forecast further into the future, say 3 months, based on the data through March 1992, we would add the most recent value, 3247.42, to three times the mean difference, 26.00. • That is, we just project the trend that far into the future. • We caution about forecasting too far into the future for such a volatile series as the Dow.
HAMMERS.XLS • A retailer has recorded its weekly sales of hammers (units purchased) for the past 42 weeks. • The data are found in the file. • The graph of this time series appears below and reveals a “meandering” behavior.
The Plot and Data • The values begin high and stay high awhile, then get lower and stay lower awhile, then get higher again. • This behavior could be caused by any number of things. • How useful is autoregression for modeling these data and how would it be used for forecasting?
Autocorrelations • A good place to start is with the autocorrelations of the series. • These indicate whether the Sales variable is linearly related to any of its lags. • The first six autocorrelations are shown below.
Autocorrelations -- continued • The first three of them are significantly positive, and then they decrease. • Based on this information, we create three lags of Sales and run a regression of Sales versus these three lags. • Here is the output from this regression
Autocorrelations -- continued • We see that R2 is fairly high, about 57%, and that se is about 15.7. • However, the p-values for lags 2 and 3 are both quite large. • It appears that once the first lag is included in the regression equation, the other two are not really needed. • Therefore we reran the regression with only the first lag include.
Forecasts from Aggression • This graph shows the original Sales variable and its forecasts
Regression Equation • The estimated regression equation isForecasted Salest = 13.763 + 0.793Salest-1 • The associated R2 and se values are approximately 65% and 155.4. The R2 is a measure of the reasonably good fit we see in the previous graph, whereas the se is a measure of the likely forecast error for short-term forecasts. • It implies that a short-term forecast could easily be off by as much as two standard errors, or about 31 hammers.
Regression Equation -- continued • To use the regression equation for forecasting future sales values, we substitute known or forecasted sales values in the right hand side of the equation. • Specifically, the forecast for week 43, the first week after the data period, is approximately 98.6 using the equation ForecastedSales43 = 13.763 + 0.793Sales42 • The forecast for week 44 is approximately 92.0 and requires the forecasted value of sales in week 43 in the equation:ForecastedSales44 = 13.763 + 0.793ForecastedSales43
Forecasts • Perhaps these two forecasts of future sales are on the mark and perhaps they are not. • The only way to know for certain is to observe future sales values. • However, it is interesting that in spite of the upward movement in the series, the forecasts for weeks 43 and 44 are downward movements.
Regression Equation Properties • The downward trend is caused by a combination of the two properties of the regression equation. • First, the coefficient of Salest-1, 0.793, is positive. Therefore the equation forecasts that large sales will be followed by large sales (that is, positive autocorrelation). • Second, however, this coefficient is less than 1, and this provides a dampening effect. • The equation forecasts that a large will follow a large, but not that large.
REEBOK.XLS • This file includes quarterly sales data for Reebok from first quarter 1986 through second quarter 1996. • The following screen shows the time series plot of these data. • Sales increase from $174.52 million in the first quarter to $817.57 million in the final quarter. • How well does a linear trend fit these data? • Are the residuals from this fit random?
Linear Trend • A linear trend means that the time series variable changes by a constant amount each time period. • The relevant equation is Yt = a + bt + Et where a is the intercept, b is the slope and Et is an error term. • If b is positive the trend is upward, if b is negative then the trend is downward. • The graph of the time series is a good place to start. It indicates whether a linear trend model is likely to provide a good fit.