Download
1 / 35
350 likes | 360 Views
Applying the Beaver Restoration Assessment Tool in Montana. Claudine Tobalske Spatial Analysis Lab Montana Natural Heritage Program University of Montana. Goals of this presentation. Give a brief introduction of the BRAT model Describe the input datasets used for Montana

E N D
Applying theBeaver Restoration Assessment Tool in Montana Claudine Tobalske Spatial Analysis Lab Montana Natural Heritage Program University of Montana
Goals of this presentation Give a brief introduction of the BRAT model Describe the input datasets used for Montana Present known and expected outputs
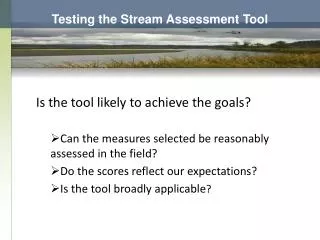
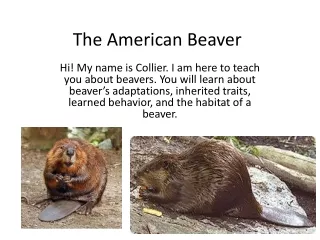
Why BRAT? • Beavers are “ecosystem engineers”; • Affordable, effective alternative to human-engineered stream restoration projects; • Unrealistic expectations? Conflicts with other activities • HSI models: system specific; use absence as proxy for habitat inappropriateness • BRAT: predicts the capacity of a landscape to support dam building(not habitat suitability or population estimates) • Regional planning tool to develop reasonable expectations of where restoration efforts are most likely to succeed.
BRAT: data requirements Dam Building Capacity: Conservation Restoration: Stream drainage network Current vegetation Historic vegetation Digital Elevation Model Low flow equation Peak flow equation Road network Railroad network Canals Land use raster Valley bottoms
BRAT: data requirements Dam Building Capacity: Conservation Restoration: Stream drainage network Current vegetation Historic vegetation Digital Elevation Model Low flow equation Peak flow equation Road network Railroad network Canals Land use raster Valley bottoms
Stream drainage network (8-digit HUC) Start with NHDFlowline Select perennial streams Add named streams Data source: National Hydrology Dataset High Resolution
Stream drainage network Stream network split into 300m segments
BRAT: data requirements Dam Building Capacity: Conservation Restoration: Stream drainage network Current vegetation Historic vegetation Digital Elevation Model Low flow equation Peak flow equation Road network Railroad network Canals Land use raster Valley bottoms
Current vegetation Data source: Montana Landcover
Current vegetation, coded Data source: Montana Landcover
BRAT: data requirements Dam Building Capacity: Conservation Restoration: Stream drainage network Current vegetation Historic vegetation Digital Elevation Model Low flow equation Peak flow equation Road network Railroad network Canals Land use raster Valley bottoms
Historic vegetation Data source: Landfire Biophysical Settings (BPS) as proxy
Historic vegetation, coded Data source: Landfire Biophysical Settings (BPS) as proxy
Current vegetation, coded Data source: Montana Landcover
Current vegetation, coded Data source: Montana Landfire 2012
BRAT: data requirements Dam Building Capacity: Conservation Restoration: Stream drainage network Current vegetation Historic vegetation Digital Elevation Model Low flow equation Peak flow equation Road network Railroad network Canals Land use raster Valley bottoms
Peak flow (2-year flood) equations • A = HUC area (square miles) • P = mean annual precipitation (inches), source: PRISM • ETSPR =mean spring (March-June) evapotranspiration (inches/month), source: Montana Climate Office • F = % HUC that is forest, source: Montana land cover • SLP50 = % HUC withslope > 50%, SLP30 = % HUC with slope > 30%, E5000 = % HUC above 5000’ elevation, and E6000 = % HUC above 6000’ elevation, source: 10 m DEM. Data source: Montana Streamstats Report 2015-5019, Chapter F
Low flow equations • Low flow equations unavailable for 4 • hydrologic regions; • Replace with October discharge values for all gauging stations available within the region; • Average over available years and across the region Data source: Montana Streamstats Report 2015-5019, Chapter G
BRAT: data requirements Dam Building Capacity: Conservation Restoration: Stream drainage network Current vegetation Historic vegetation Digital Elevation Model Low flow equation Peak flow equation Road network Railroad network Canals Land use raster Valley bottoms
Human impacts Data source: Montana MSDI Transportation Dataset (roads/railroads); NHD HighRes (canals)
BRAT: data requirements Dam Building Capacity: Conservation Restoration: Stream drainage network Current vegetation Historic vegetation Digital Elevation Model Low flow equation Peak flow equation Road network Railroad network Canals Land use raster Valley bottoms
Human impacts Data source: Montana landcover
BRAT: data requirements Dam Building Capacity: Conservation Restoration: Stream drainage network Current vegetation Historic vegetation Digital Elevation Model Low flow equation Peak flow equation Road network Railroad network Canals Land use raster Valley bottoms
Human impacts constrained to valley bottoms Data source: 10m DEM, Valley Bottom Mapping Tool (RSAC)
BRAT outputs Dam Building Capacity: Conservation Restoration: Baseflowstreampower/ High flow streampower • Existing dam building • capacity Existing complex size capacity Historic dam building capacity • Historic complex size • capacity Conflict potential Beaver management zones Beaver management zones V2 beta
BRAT: limitations/issues Work in progress; stable release at unknown date Outputs only as good as inputs: landcover, NHD inaccuracy/errors; missing low flow equations Model developed for Utah; extrapolation to Montana?
BRAT: what’s next? • An WebGIS application that would allow users to: • Explore and visualize BRAT runs for the Western US in a Google Maps interface • Run and produce simple BRAT scenarios • Export BRAT outputs as KML or shapefiles • An ArcGIS AddIn with Project Explorer to make it easier to run BRAT; • A stand-alone GUI application (without mapping functionality).
BRAT: what’s next? • Complement BRAT with R-CAT (Riparian Condition Assessment Toolbox) to plan and prioritize projects, help researchers and managers assess riparian condition and recovery potential over large regions and watersheds: • V-BET: Valley Bottom Extraction Tool; • RVD: Riparian Vegetation Departure tool; • RCA: Riparian Condition Assessment tool; • RRP: Riparian Recovery Potential tool.
Questions? For more information: Claudine Tobalske Claudine.tobalske@umontana.edu 406-243-5196 http://brat.riverscapes.xyz/ http://rcat.riverscapes.xyz/