Download
1 / 28
280 likes | 405 Views
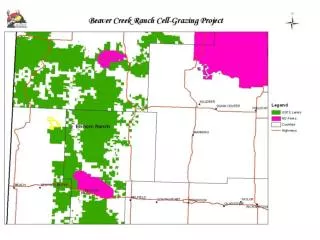
Stream Pollution Assessment of Beaver Creek. By Joe Wendtland and Loyal Wergedal. Overview of Project. Conducted in Eau Claire County, Fall Creek Wisconsin From October 2000 to May 2001.

E N D
Stream Pollution Assessment of Beaver Creek By Joe Wendtland and Loyal Wergedal
Overview of Project • Conducted in Eau Claire County, Fall Creek Wisconsin • From October 2000 to May 2001. • Worked with Paul Tweed, biology teacher of Augusta and Scott Thiel, science teacher at Altoona and Beaver Creek Reserve and staff.
Why we chose the stream? • We can’t see inside the stream, like we can on the ground. • Find what is in our water. • See how pollution affects our water and the living organisms that live in the water as well.
Hypothesis • Beaver Creek Watershed has a good water quality rating.
What is our project? • Insects • Fish • Chemicals • Temperatures
Disrupt stream bottom into D-framed net Empty all of contents into collection pan Remove 100 insects randomly (to avoid a bias collection) Insect collections
Some determinates of insect families include: body shape, gill structure, wings, mandible, and abdomen. Use FBI key by looking at these features Identify the Family of Each Insect
Temperature • Change in stream temperature between the hobos. • Temperature recorded by hobos, small devices that records temperature every 4 hours. • Placed 2 hobos in the stream one mile apart • Placed 1 above the stream
Why Collect Temperature Data • Correlation between fish and temperature • Correlation between dissolved oxygen and temperature • Change is temperature between two hobos in stream
Chemical Tests • Collect Water Samples from 2 sites • Analyze in Lab for concentrations • Decipher change
Nitrate Information • NO3 • Found in farm fertilizers • Promotes plant growth • Too much pollution causes a decrease in oxygen • U.S. Public Health Service only allows 10 mg/L. in public drinking water
Phosphate Information • PO4 • Found in fertilizers and pesticides • Stimulates plant growth • .1 mg/L. is recommended maximum for rivers and streams
Turbidity • Measure of sediment in water • Enables us to determine whether erosion or excessive growth is taking place
Dissolved Oxygen Information • O2 dissolved in water • Diffusion from surrounding air • Photosynthesis • Reduced by decomposition of excessive plant growth
Placed 2 minnow traps one mile apart at Field Station Collected every 4-7 days Measured and identified each minnow Fish Collections
Central Mudminnow Umbra Limi
Summary • From chemical tests we found stream has high phosphate levels but all other tests indicated good quality • Insect tests indicated overall good quality with minimal change • Temperature data fluctuated normally • Minnows found were typical of habitat
Concerns • Tests valid • Phosphate levels • Future interests in the Beaver Creek Watershed
Closing Comments • More work than we had anticipated. • Great class, but students must be committed because this individual work. • Only factor that would make this class even better is more time.