Download
1 / 9
90 likes | 95 Views
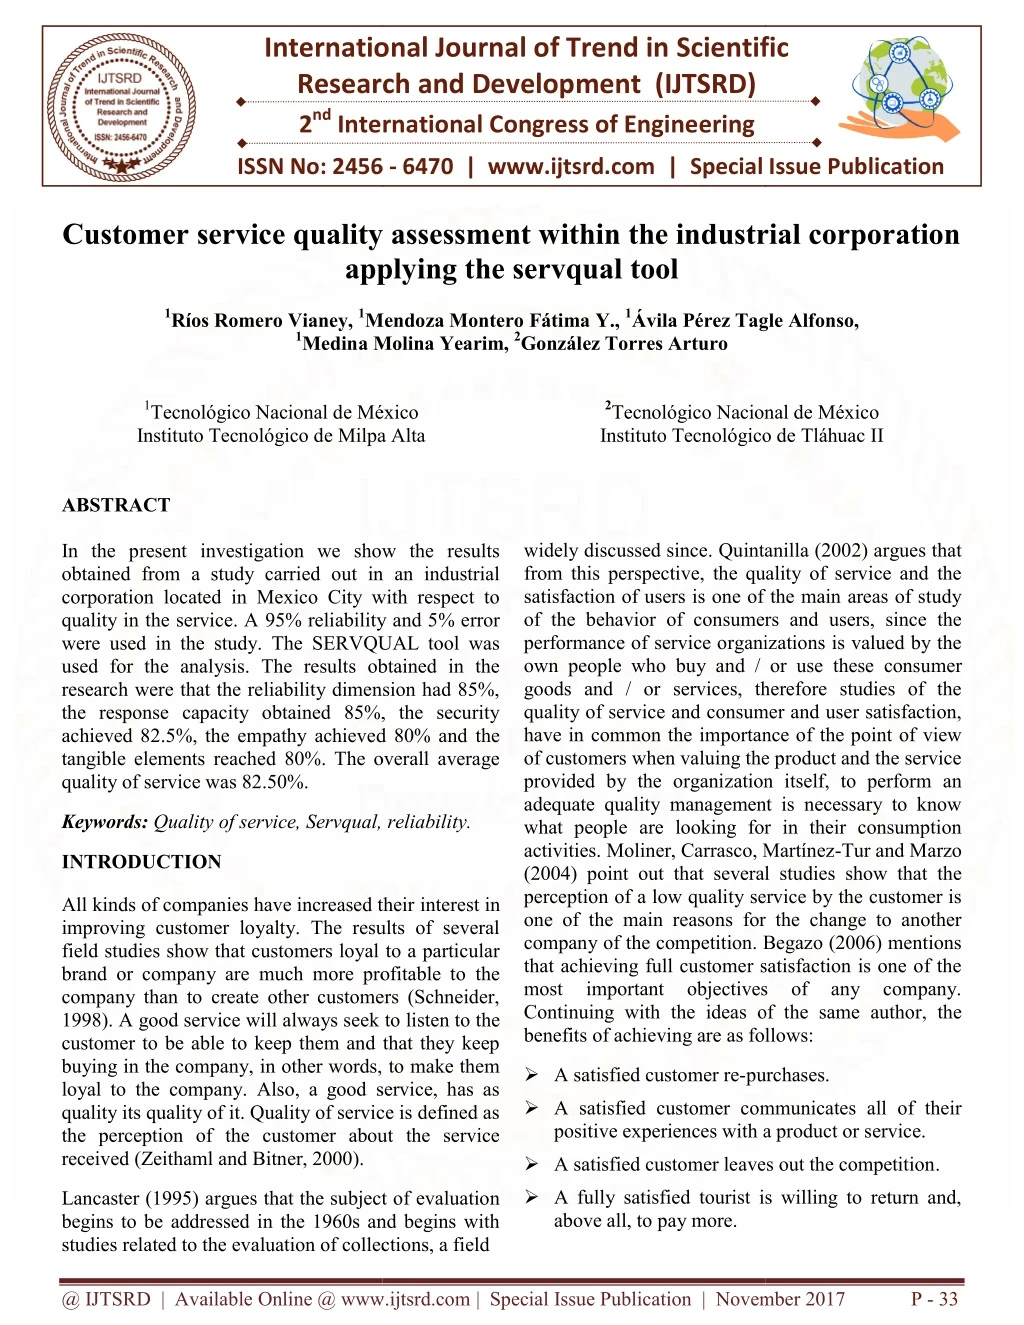
In the present investigation we show the results obtained from a study carried out in an industrial corporation located in Mexico City with respect to quality in the service. A 95 reliability and 5 error were used in the study. The SERVQUAL tool was used for the analysis. The results obtained in the research were that the reliability dimension had 85 , the response capacity obtained 85 , the security achieved 82.5 , the empathy achieved 80 and the tangible elements reached 80 . The overall average quality of service was 82.50 . Ru00c3u00ados Romero Vianey "Customer Service Quality Assessment within the Industrial Corporation Applying the Servqual Tool" Published in International Journal of Trend in Scientific Research and Development (ijtsrd), ISSN: 2456-6470, Special Issue | 2nd International Congress of Engineering , October 2017, URL: https://www.ijtsrd.com/papers/ijtsrd5824.pdf Paper URL: https://www.ijtsrd.com/engineering/other/5824/customer-service-quality-assessment-within-the-industrial-corporation-applying-the-servqual-tool/ru00edos-romero-vianey<br>

E N D
International Research 2nd International Congress of Engineering International Congress of Engineering ustomer service quality assessment within the industrial corporation applying the servqual tool International Journal of Trend in Scientific Research and Development (IJTSRD) Scientific ISSN No: 2456 ISSN No: 2456 - 6470 | www.ijtsrd.com | Special Issue Special Issue Publication Customer service quality assessment within the industrial corporation applying the servqual tool 1Ríos Romero Vianey, 1Mendoza Montero Fátima Y., 1Medina Molina Yearim, Medina Molina Yearim, 2González Torres Arturo Tecnológico Nacional de México Instituto Tecnológico de Milpa Alta ustomer service quality assessment within the industrial corporation Mendoza Montero Fátima Y., 1Ávila Pérez Tagle Alfonso, Ávila Pérez Tagle Alfonso, 1Tecnológico Nacional de México Instituto Tecnológico de Milpa Alta 2Tecnológico Nacional de México Instituto Tecnológico de Tláhuac II Instituto Tecnológico de Tláhuac II Tecnológico Nacional de México ABSTRACT In the present investigation we show the results obtained from a study carried out in an industrial corporation located in Mexico City with respect to quality in the service. A 95% reliability and 5% error were used in the study. The SERVQUAL tool was used for the analysis. The results obtained in the research were that the reliability dimension had 85%, the response capacity obtained 85%, the security achieved 82.5%, the empathy achieved 80% and the tangible elements reached 80%. The overall average quality of service was 82.50%. widely discussed since. Quintanilla from this perspective, the quality of service and the satisfaction of users is one of the main areas of study of the behavior of consumers and users, since the performance of service organizations is valued by the own people who buy and / or use these consumer goods and / or services, therefore studies of the quality of service and consumer and user satisfaction, have in common the importance of the point of view of customers when valuing the product and the service provided by the organization itself, to perform an adequate quality management is necessary to know what people are looking for in their consumption activities. Moliner, Carrasco, Martínez (2004) point out that several studies show that the perception of a low quality service by the customer is one of the main reasons for the change to another company of the competition. Begazo (2006) mentions that achieving full customer satisfaction is one of the most important objectives Continuing with the ideas of the same author, the benefits of achieving are as follows: benefits of achieving are as follows: intanilla (2002) argues that In the present investigation we show the results obtained from a study carried out in an industrial corporation located in Mexico City with respect to from this perspective, the quality of service and the satisfaction of users is one of the main areas of study of the behavior of consumers and users, since the performance of service organizations is valued by the o buy and / or use these consumer goods and / or services, therefore studies of the quality of service and consumer and user satisfaction, have in common the importance of the point of view of customers when valuing the product and the service the organization itself, to perform an adequate quality management is necessary to know what people are looking for in their consumption Moliner, Carrasco, Martínez-Tur and Marzo (2004) point out that several studies show that the a low quality service by the customer is one of the main reasons for the change to another company of the competition. Begazo (2006) mentions that achieving full customer satisfaction is one of the most important objectives of the ideas of the same author, the ability and 5% error were used in the study. The SERVQUAL tool was used for the analysis. The results obtained in the research were that the reliability dimension had 85%, the response capacity obtained 85%, the security d 80% and the tangible elements reached 80%. The overall average Keywords: Quality of service, Servqual, reliability. Quality of service, Servqual, reliability. INTRODUCTION All kinds of companies have increased their improving customer loyalty. The results of several field studies show that customers loyal to a particular brand or company are much more profitable to the company than to create other customers (Schneider, 1998). A good service will always seek to listen to the customer to be able to keep them and that they keep buying in the company, in other words, to make them loyal to the company. Also, a good service, has as quality its quality of it. Quality of service is defined as the perception of the customer about the service received (Zeithaml and Bitner, 2000). All kinds of companies have increased their interest in improving customer loyalty. The results of several field studies show that customers loyal to a particular brand or company are much more profitable to the company than to create other customers (Schneider, of any any company. company. k to listen to the customer to be able to keep them and that they keep buying in the company, in other words, to make them loyal to the company. Also, a good service, has as quality its quality of it. Quality of service is defined as customer about the service A satisfied customer re-purchases. purchases. A satisfied customer communicates all of their positive experiences with a product or service. positive experiences with a product or service. A satisfied customer communicates all of their A satisfied customer leaves out the competition A satisfied customer leaves out the competition. A fully satisfied tourist is willing to return and, above all, to pay more. A fully satisfied tourist is willing to return and, Lancaster (1995) argues that the subject of evaluation begins to be addressed in the 1960s and begins with studies related to the evaluation of collections, a field studies related to the evaluation of collections, a field Lancaster (1995) argues that the subject of evaluation begins to be addressed in the 1960s and begins with @ IJTSRD | Available Online @ www.ijtsrd.com @ IJTSRD | Available Online @ www.ijtsrd.com | Special Issue Publication | November November 2017 P - 33
International Journal of Trend in Scientific Research and Development (IJTSRD) ISSN: 2456-6470 Special Issue of 2nd International Congress of Engineering For all of the above, Orgambídez and Almeida (2015) point out that the study of the factors related to the quality of service has acquired special importance as a key competitiveness element, especially the role played by the contact employee. Gadotti and Franca (2008) argue that quality assessment has always been more complex for services than for products because they are inherently heterogeneous, inseparable between production and consumption, intangibility and perishability. Gabriel (2003) points out that one of the most important works about the quality of services is the "Service Profit Chain" (SPC) model, made by the authors Heskett, Sasser and Schlesinger based on the analysis of successful service companies. This model combines strategies for the creation of value of the service through the satisfaction and loyalty of the clients and the satisfaction and productivity of the employees. Another model that has taken a lot of importance in measuring the quality of services is the SERVQUAL model, which is an instrument widely accepted by the international scientific community that measures the quality of service and summarizes the models mentioned above. This scale was designed by researchers Parasuraman, Zeithaml and Berry in 1985 (Moreno and Coromoto, 2006), and has undergone some changes and improvements, as well as been revised and validated in Latin America by Michelsen Consoulting, supported by the Latin American Institute of Quality in Services in 1992 (Morales, 2005). Researchers have determined that when one compares the general expectation of the user (also called client, patient, beneficiary, etc.) with the perception of the service received from an organization, it is a measure of quality in the service, and The gap between the two indicates the areas of opportunity for improvement (Morales, 2005). Importance of measuring the quality of services A service is defined as a type of economic good, it constitutes what it calls the tertiary sector, everyone who works and does not produce goods is supposed to produce services (Fisher and Navarro, 1994). Bon (2008) argues that it is a means to deliver value to customers, facilitating the results that customers want to achieve without assuming specific costs or risks. Kotler (1997) points out that a service is any activity or benefit that one party offers to another; are essentially intangible and do not give rise to ownership of anything. Its production may or may not be linked to a physical product. Lehtinen and Lehtinen (1982) argue that service quality occurs in the interaction between a customer and the elements of the organization providing the service. Müller (2001) mentions that a company is in balance and is of high quality when it exceeds expectations of customers, staff and shareholders. Requena and Serrano (2007) point out that a high or low definition of quality of service depends on how consumers perceive the total service, in the context of their expectations. Pizzo (2013) mentions that it is the habit developed and practiced by an organization to interpret the needs and expectations of its clients and consequently offer them an accessible, adequate, agile, flexible, appreciable, useful, timely, safe and reliable service, even under unforeseen situations or errors, in such a way that the client feels understood, attended and served personally, with dedication and efficiency, and surprised with greater value than expected, thus providing higher income and lower costs for the organization. The fundamental characteristics of services are: intangibility, non- differentiation between production and delivery, and inseparability of production (Parasuraman, Zeithaml and Berry, 1985). Cronin and Taylor (1994) mention that the ServQual and Servperf scales are tools designed to measure the quality of service. Customer satisfaction is one of the fundamental results of providing a proper customer service. The importance of measuring the quality of service in a company is very important today because in this study you will be able to observe the perception that the customer has towards the products and / or services that the organizations offer. Likewise, companies that are looking for ISO 9000 certification should emphasize the importance of measuring their customers, because the same standard marks that this should be done. Quality and Management (2011) defines customer satisfaction as the result of the comparison that inevitably takes place between the customer's previous expectations placed on the products and / or services and on the processes and image of the company, with respect to the perceived and consumption @ IJTSRD | Available Online @ www.ijtsrd.com | Special Issue Publication | November 2017 P - 34
International Journal of Trend in Scientific Research and Development (IJTSRD) ISSN: 2456-6470 Special Issue of 2nd International Congress of Engineering value at the end of the business relationship. Aguilar and Jáuregui (2004) argue that it costs four or five times more to get a new customer than to keep one that already has. But it is more spent on attracting more customers than on maintaining what they already have. Satisfied customers are loyal customers. A customer's loyalty is worth at least 10 times the price of a purchase. Servqual Model Morales (2003) argues that the SERVQUAL model has been applied to several areas since its inception. The SERVQUAL model uses a scale ranging from 1 to 7 of semantic differential (Osgood, Suci and Tannenbaum, 1957). Pineda, Estrada, and Parra (2011) point out that the expectations and perceptions were assessed by the level of importance that the respondents give each of the 22 items. As for perceptions, 1 indicates that one is totally dissatisfied and 7 totally satisfied; and in expectations, 1 indicates totally insignificant and 7 totally important. Universidad TecVirtual del Sistema Tecnológico de Monterrey (2012) points out that the Servqual instrument serves to measure customer expectations of a service organization, the perceptions that the same customers have of that service organization and the hierarchy that customers make of the service dimensions relevant to the organization (typically tangible aspects of reliability, assurance, response speed and empathy). Among the applications of the Servqual model, Dal Corso, Vianello, De Carlo and Robusto (2001) evaluated the quality of school services with a sample of 640 parents, teachers, and auxiliary staff in Padua. In addition, Lowndes and Dawes (2001) examine in their study whether the dimensions of service quality that emerge from the factorial analysis in a company's purchasing data based on the SERVQUAL instrument are the same as those found in the literature. Dimensions of SERVQUAL This instrument has been applied in organizations, both public and private and in several entities, which has allowed validating and revising the tool as an instrument for measuring quality in the service (Morales, 2005). AITECO consultants (2016) points out that the dimensions of this model are as follows: Reliability: Ability to perform the service carefully and reliably. Responsiveness: Willingness and willingness to help users and provide fast service. Safety: Knowledge and attention shown by employees and their ability to build trust and confidence. Empathy: Personalized organization dispenses to its clients. Tangible Elements: Appearance of physical facilities, equipment, communication materials. General objective Evaluate the quality of customer service within the Industrial Corporate by applying the SERVQUAL tool. Specific objectives Understand the contextualization of service quality. attention that the personnel and Know the existing models to evaluate the quality of the service. Calculate the representative sample using 95% confidence. Apply the Servqual questionnaire in the representative sample. Analyze questionnaire applied to the representative sample. the results obtained from the Evaluate the results obtained from the analysis of the questionnaires Justification Talking about quality in services is more complicated than it seems, because it involves several aspects and dimensions such as culture and values that dominate the population and are attributed to these activities, in addition, the provision of a service must be adequate the context and preferences of the provider and focus on meeting the needs of those who use it, but in an optimal way. @ IJTSRD | Available Online @ www.ijtsrd.com | Special Issue Publication | November 2017 P - 35
International Journal of Trend in Scientific Research and Development (IJTSRD) ISSN: 2456-6470 Special Issue of 2nd International Congress of Engineering In order to provide quality services, it is necessary to develop the people (Human talent) who are providing the service, however, it is extremely important to find a way to evaluate the perception of quality in the service that users of the same have. In this way we can train and develop human talent to provide a quality service and have satisfied customers, which will determine the increase of them. It is necessary then to know what the expectations of our users are and compare them with their perceptions of the service received to determine the level of quality in the service and obtain an indicator of improvement, i.e., determine dissatisfaction gaps to improvement and to be able to offer the users a truly quality service. It is for all of the above, that it becomes necessary to have an analysis that allows us to determine our areas of opportunity and to be able to improve them to achieve an optimal development of human talent, which in turn will derive in the economic development of the organization, which will impact on the development of the country. Method Description The study was carried out in 7 stages as shown in Figure 1. the strategies specific design of 1.Conceptualization of quality in service. 2. Design of the questionnaire. 3. Calculation of the sample 4. Management of the questionnaire. 5. Analysis of results. 6. Conclusions. 7. Recommendations. Graph 1. Methodological steps Table 1. Example of distribution of questions and their dimension Dimension Tangible elements Reliability Answer's capacity Security Empathy 3. Calculation of the sample. The sample of the client population of the organization was determined. The formula used was the one proposed by Dr. Bolaños (2012), which is used for finite or known populations. The formula is as follows: 1. Conceptualization of quality in the service. A bibliographic review of the topic was carried out. 2. Design of the questionnaire. A booklet was elaborated in which general data of the respondents were drawn up and the 22 questions that form the Servqual tool were integrated. Table 1 shows how the dimensions are distributed with the queries of the Servqual model. Questions 1 a la 4 5 a la 9 10 a la 13 14 a la 17 18 a la 22 @ IJTSRD | Available Online @ www.ijtsrd.com | Special Issue Publication | November 2017 P - 36
International Journal of Trend in Scientific Research and Development (IJTSRD) ISSN: 2456 Special Issue of Special Issue of 2nd International Congress of Engineering Scientific Research and Development (IJTSRD) ISSN: 2456 Scientific Research and Development (IJTSRD) ISSN: 2456-6470 2 Z * N * p 2 * q n 2 i ( N ) 1 Z * p * q Where: n: sample size N: population size Z: value corresponding to the gauss distribution, for the investigation Z = 95%, which is equal to 1.96. p: expected prevalence of the parameter to be evaluated, if not known (p = 0.5), which makes the sample size larger. q: 1 - p (if p = 70%, q = 30%) i: error expected to be committed if it is 5%, i = The development of the formula is as follows: 0 * 30 * ) 96 . 1 ( The study indicated that of a population of 30 clients with which the organization counts, using a 95% reliability and a 5% error allowed, will require 28 clients for the investigation. 4. Management of the questionnaire. The questionnaire was applied from an intentional non probabilistic sampling and the questionnaire was administered through Microsoft Excel®. 5. Analysis of results. We proceeded to perform a database in Excel with the information obtained and plotted the results. 6. Conclusions. After analyzing the data obtained from the representative sample, both general and specific conclusions were taken, in the conclusions section the above is stated. 7. Design of proposals for action. From the analysis of the results and conclusions obtained, lines of action are proposed to improve the quality of the service. Z: value corresponding to the gauss distribution, for the investigation Z = 95%, which is equal to 1.96. Z: value corresponding to the gauss distribution, for the investigation Z = 95%, which is equal to 1.96. p: expected prevalence of the parameter to be evaluated, if not known (p = 0.5), which makes the sample size p: expected prevalence of the parameter to be evaluated, if not known (p = 0.5), which makes the sample size i: error expected to be committed if it is 5%, i = 0.05 The development of the formula is as follows: 2 5 . 0 5 . 0 * 28 81 . 28 . 81 n 27 27 . 89 28 ) 1 . 1 ( 2 2 . 0 ( 05 ) 30 ( 96 96 ) 5 . 0 * 5 . 0 * . 0 Analysis of results The first analysis that was carried out was the general data of the organization's clients. Table 2 shows that the majority of clients are women between the ages of 30 and 40. Table 2. Example of general data analysis Age Total 20-30 7 0725 . 0 9604 . 1 0329 The study indicated that of a population of 30 clients with which the organization counts, using a 95% reliability and a 5% error allowed, will require 28 that was carried out was the general data of the organization's clients. Table 2 shows that the majority of clients are women between the ages of Management questionnaire was applied from an intentional non- probabilistic sampling and the questionnaire was of the questionnaire. The Table 2. Example of general data analysis el®. Gender Male Male Gender Total 18 . Analysis of results. We proceeded to perform a database in Excel with the information obtained and 30-40 >40 12 9 Female Female 20 . Conclusions. After analyzing the data obtained from the representative sample, both general and Regarding the analysis of the results of the representative sample to evaluate service quality, a general customer satisfaction index of 0.825 was found, indicating acceptable satisfaction with areas for improvement. The highest dimensions were: reliability and responsiveness both with 85%; otherwise, the dimensions with lower scores were: empathy and tangible elements both with 80%. Figure 2 shows an example of the results obtained. Regarding the analysis of the results of the representative sample to evaluate service quality, a general customer satisfaction index of 0.825 was found, indicating acceptable satisfaction with areas for improvement. The highest dimensions were: y and responsiveness both with 85%; otherwise, the dimensions with lower scores were: empathy and tangible elements both with 80%. Figure 2 shows an example of the results obtained. en, in the conclusions . Design of proposals for action. From the analysis of the results and conclusions obtained, lines of action are proposed to improve the quality of the service. @ IJTSRD | Available Online @ www.ijtsrd.com @ IJTSRD | Available Online @ www.ijtsrd.com | Special Issue Publication | November 2017 Publication | November 2017 P - 37
International Journal of Trend in Scientific Research and Development (IJTSRD) ISSN: 2456 Special Issue of Special Issue of 2nd International Congress of Engineering Scientific Research and Development (IJTSRD) ISSN: 2456 Scientific Research and Development (IJTSRD) ISSN: 2456-6470 ANALYSIS OF THE RESULTS ANALYSIS OF THE RESULTS 85.00 85.00 82.50 82.50 80.00 80.00 Fiabilidad Capacidad de Respuesta Capacidad de Seguridad Empatía E. Tangibles Promedio Promedio Figure 2. Example of the analysis of the results. Figure 2. Example of the analysis of the results. For the dimension of tangible elements, which is one of the lowest, the questions that had the lowest score with the representative sample of clients were question two and question four. Question two refers to whether the physical facilities of the company look visually app material elements of the business related to the service (brochures, statements, etc.) are visually appealing material elements of the business related to the service (brochures, statements, etc.) are visually appealing material elements of the business related to the service (brochures, statements, etc.) are visually appealing. of tangible elements, which is one of the lowest, the questions that had the lowest score with the representative sample of clients were question two and question four. Question two refers to whether the of tangible elements, which is one of the lowest, the questions that had the lowest score with the representative sample of clients were question two and question four. Question two refers to whether the physical facilities of the company look visually appealing. While Question 4 has to do with whether the ealing. While Question 4 has to do with whether the TANGIBLE ELEMENTS 81.63 81.63 78.57 78.06 Pregunta 1 Pregunta 2 Pregunta 3 Pregunta 4 Figure 3. Example of the results obtained for the dimension of tangible elements. Figure 3. Example of the results obtained for the dimension of tangible elements. Figure 3. Example of the results obtained for the dimension of tangible elements. For the dimension of empathy, which is the other dimension with the lowest score, the questions that had the lowest score with the representative sample of clients were question twenty and question twenty twenty refers to whether the company has empl question twenty-two has to do with whether employees in the company understand the specific needs of their customers. dimension of empathy, which is the other dimension with the lowest score, the questions that had the lowest score with the representative sample of clients were question twenty and question twenty-two. Question oyees who offer personalized attention to their customers. While dimension of empathy, which is the other dimension with the lowest score, the questions that had the lowest score with the representative sample of clients were question twenty and question twenty twenty refers to whether the company has employees who offer personalized attention to their customers. While two has to do with whether employees in the company understand the specific needs of their two has to do with whether employees in the company understand the specific needs of their @ IJTSRD | Available Online @ www.ijtsrd.com @ IJTSRD | Available Online @ www.ijtsrd.com | Special Issue Publication | November 2017 Publication | November 2017 P - 38
International Journal of Trend in Scientific Research and Development (IJTSRD) ISSN: 2456 Special Issue of Special Issue of 2nd International Congress of Engineering Trend in Scientific Research and Development (IJTSRD) ISSN: 2456 Trend in Scientific Research and Development (IJTSRD) ISSN: 2456-6470 EMPATHY 82.14 82.14 82.14 76.53 76.53 Pregunta 18 Pregunta 19 Pregunta 19 Pregunta 20 Pregunta 21 Pregunta 22 Figure 4. Example of the results obtained for the empathy dimension Figure 4. Example of the results obtained for the empathy dimension Figure 4. Example of the results obtained for the empathy dimension. Acknowledgment Marrón Ramos Domingo Noé the project. Conclusiones Although companies expect greater investment in customer service, only 38% of organizations view this area as a company-wide priority, while the rest consider it only a post-sale function (Forbes Mexico, 2015). Although companies expect greater investment in customer service, only 38% of organizations view this wide priority, while the rest sale function (Forbes Mexico, Marrón Ramos Domingo Noé for his advice on Pliego Martínez Odette Alejandra on the project. Pliego Martínez Odette Alejandra for her advice Ramírez Castillejo Rosa Isela the project. Ramírez Castillejo Rosa Isela for her advice on The present research reached the general objective set. It was possible to evaluate the quality of customer service within the Industrial Corporate by applying the SERVQUAL tool. eneral objective set. It was possible to evaluate the quality of customer service within the Industrial Corporate by applying Reyes Mérida César P.A. project. Reyes Mérida César P.A. for his advice on the Ramírez Castillejo Griselda project. Ramírez Castillejo Griselda for her advice on the It is deduced using a 95% reliability and 55 error in the investigation, that the quality of the service is of 82.50%. Also the understanding contextualization of service knowledge of the existing models to evaluate the quality of the service was achieved. It is deduced using a 95% reliability and 55 error in the investigation, that the quality of the service is of 82.50%. Also the understanding contextualization of service knowledge of the existing models to evaluate the References of and and of the the the the quality quality 1)Aguilar, K.i E, Jáuregui, C. A. (2004) con actitud de servicio. México: Aguilar, K.i E, Jáuregui, C. A. (2004). Trabajar México: Árbol Editorial Recommendations 2)AITECO SERVQUAL de Calidad de Servicio. AITECO Consultores. Granada, España. Consultores. Granada, España. Consultores. Consultores. (2016). (2016). El El Modelo Modelo SERVQUAL de Calidad de Servicio. AITECO With the results obtained in the present investigation, the following is recommended: With the results obtained in the present investigation, 3)Begazo Villanueva, J. D. (2006). ¿Cómo medimos el servicio? Gestión en el Tercer Milenio. Revista de Investigación de la Facultad de Ciencias Administrativas. Universidad Nacional Mayor de San Marcos. Lima. Perú. Begazo Villanueva, J. D. (2006). ¿Cómo medimos el servicio? Gestión en el Tercer Milenio. Revista de Investigación de la Facultad de Ciencias as. Universidad Nacional Mayor de For the empathy dimension, it is advisable to train the organization's employees in customer service, as well as to train employees on topics such as motivation and communication strategies. motivation and communication strategies. For the empathy dimension, it is advisable to train the organization's employees in customer service, as well as to train employees on topics such as For the dimension of tangible elements, it is recommended to create an audit plan where each week an evaluation of the tangible elements is recorded; in addition, it proposes the creation of visual controls of modern and fresh appearance. In the medium term, an evaluation is recommended using ergonomics to make future changes in the distribution of furniture within the company. distribution of furniture within the company. For the dimension of tangible elements, it is recommended to create an audit plan where each week an evaluation of the tangible elements is recorded; in addition, it proposes the creation of visual controls of modern and fresh appearance. In the medium term, an evaluation is recommended ics to make future changes in the 4)Bolaños Rodríguez, E. (2012). Muestra y Muestreo. Asignatura: Desarrollo Tecnológico. Área Académica: Gestión Tecnológica. Escuela Superior e Tizayuca. Universidad Autónoma de Hi Universidad Autónoma de Hidalgo. Bolaños Rodríguez, E. (2012). Muestra y Muestreo. Asignatura: Desarrollo Tecnológico. Área Académica: Gestión Tecnológica. Escuela Superior e Tizayuca. Estadística Estadística para para el el 5)Bon (2008). Gestión de Servicios de TI basada en ITIL V3. Primera edición. Editorial del Gobierno Británico. Reino Unido. p.p. 21. Británico. Reino Unido. p.p. 21. Bon (2008). Gestión de Servicios de TI basada en ITIL V3. Primera edición. Editorial del Gobierno @ IJTSRD | Available Online @ www.ijtsrd.com @ IJTSRD | Available Online @ www.ijtsrd.com | Special Issue Publication | November November 2017 P - 39
International Journal of Trend in Scientific Research and Development (IJTSRD) ISSN: 2456-6470 Special Issue of 2nd International Congress of Engineering 6)Calidad y Gestión. (2011). La satisfacción del cliente y su importancia para la empresa. Calidad y Gestión. service differences: A contextual approach in hotels. Revista de Psicología Social Aplicada, 14, 73-85. and extra-role customer service 7)Cronin, J.J. y Taylor, S. A. (1994). Servperf versus servQual: reconciling performancebased and perceptions minus expectations measurement of service quality”, in: Journal of Marketing, 58, 125-131. 18)Morales, E. (2005). Escala Multidimensional SERVQUAL. Facultad de Ciencias Empresariales Universidad del Bío-Bío, Chile. 19)Morales Psicosocial de la calidad en los servicios municipales deportivos: aportaciones desde el análisis de variabilidad. Universidad de Málaga: Tesis doctoral. Sánchez, V. (2003). Evaluación 8)Dal Corso, L., Vianello, M., De Carlo, N. A. y Robusto, E. (2001). The valuation of the school services quality: An application of the Q-sort to the Servqual method. Testing Metodologia, 103-115. Psicometria 20)Müller de la Luna E. (2003). Cultura de calidad de servicios, México: Ed. Trillas. 9)Fisher, L. y Navarro, V. (1994). Introducción a la investigación de mercado (3ª ed.). 21)Orgambídez Ramos, A. y Almeida, M. H. (2015). Antecedentes organizacionales de la calidad de servicio: un modelo de relaciones estructurales. Tourism & Management Studies. 10)Forbes México. (2015). Empresas desconocen el potencial de la atención al cliente. Negocios. Forbes México. 22)Osgood, C.E., Suci, G., y Tannenbaum, P. (1957). The measurement of meaning. Urbana, IL: University of Illinois Press. 11)Gadotti dos Anjos, S. J. y Franca de Abreu, A. (2008). La medición de la calidad de servicio: una aplicación en empresas hoteleras. Revista Europea de Dirección y Economía de la Empresa, vol. 18, núm. 2, pp. 175-186. ISSN 1019-6838 23)Parasuraman, A., Zeithaml, V., & Berry, L. (1985). A Conceptual Model of Service Quality and its Implications for Future Research. Journal of Marketing, 49(4), 41-50. 12)Gabriel Weil, A. S. (2003). Medición de la Calidad de los Servicios. Maestría en Dirección de Empresas. Universidad del CEMA. Buenos Aires. Argentina. 24)Pineda, U., Estrada, M. y Parra, M. (2011). Aplicación del modelo herramientas de ingeniería de la calidad para la planificación del servicio en la Biblioteca Central de la Universidad de Antioquia. SERVQUAL y 13)Kotler, P. (1997). Mercadotecnia. México: Prentice-Hall. 14)Lancaster, F.W. (1995) The evaluation of library services : a concise review of the existing literature. Investigación archivonomía, bibliotecología e información. 25)Pizzo, M. (2013). Construyendo una definición de Calidad en el Servicio. Bibliotecológica: 26)Quintanilla, I. (2002). Psicología social del consumidor. Valencia: Promolibro. 15)Lehtinen, J.r. y lehtinen, O. (1982). Service quality: a study of unpublished working paper, helsinki: service management institute. 27)Requena Ponce, M. V. y Serrano López, G. C. (2007). Calidad del servicio desde la perspectiva de clientes, usuarios y auto-percepción de empresas de captación de talento. Escuela de Ciencias Sociales, Mención Recursos Humanos. Ciencias Económicas y Sociales. Universidad Católica Andrés Bello. Caracas. quality dimensions. 16)Lowndes, M. y Dawes, J. (2001). Do distinct SERVQUAL dimensions emerge from mystery shopping data? A test of convergent validity. Canadian Journal of Program Evaluation, 41-53. Relaciones Industriales, Facultad de 17)Moliner, C., Carrasco, H., Martínez-Tur, V. y Marzo, J. C. (2004). Diferencias en clima de servicio y conductas extra-rol hacia el cliente: Una aproximación contextual en hoteles Climate for 28)Schneider, B., White, S.S., y Paul, M.C. (1998). Linking service climate and customer perceptions of service quality: Test of a causal model. Journal of Applied Psychology. @ IJTSRD | Available Online @ www.ijtsrd.com | Special Issue Publication | November 2017 P - 40
International Journal of Trend in Scientific Research and Development (IJTSRD) ISSN: 2456-6470 Special Issue of 2nd International Congress of Engineering 29)Universidad TecVirtual del Sistema Tecnológico de Monterrey. (2012). El instrumento Servqual. Círculo Tec. Universidad TecVirtual del Sistema Tecnológico de Monterrey. 30)Zeithaml, V. A., y Bitner, M. J. (2000). Services marketing: Integrating customer focus across the firm. 2nd ed. Boston: McGraw-Hill. @ IJTSRD | Available Online @ www.ijtsrd.com | Special Issue Publication | November 2017 P - 41