Download
1 / 44
580 likes | 1.34k Views
Epidemiology of Road Traffic Accidents. Framework. 1.Introduction 2.Magnitude of Problem 3.Risk Factors 4.Social Impact 5.Haddon Matrix 6.Interventions 7.Recent Road safety initiatives by Government of India 8.Current status 9. Success stories 10. Conclusion 11. References.

E N D
Framework • 1.Introduction • 2.Magnitude of Problem • 3.Risk Factors • 4.Social Impact • 5.Haddon Matrix • 6.Interventions • 7.Recent Road safety initiatives by Government of India • 8.Current status • 9. Success stories • 10. Conclusion • 11. References
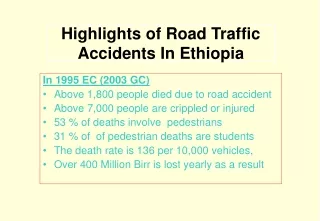
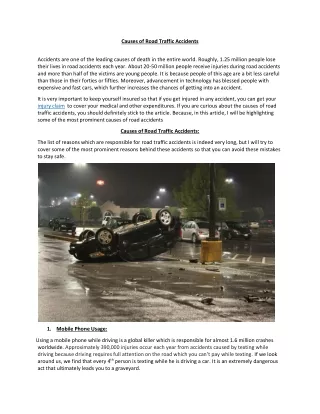
Introduction • RTA’s is major public health and development crisis, and are predicted to increase if road safety is not addressed adequately by countries. • Amongst the leading causes of deaths, disabilities and hospitalizations with severe socioeconomic costs across the world, however more so in developing countries like India. • In the year 2011, there was one road accident every minute, and one road accident death in less than four minutes, many of these victims are young people, those who are economically active. • Road traffic accidents are amenable to remedial action. • Many countries have witnessed drop in road accidents and fatalities by adopting multipronged approach to road safety, The challenge for India is to adapt and evaluate these approaches to suit our needs.
Magnitude • Approx 1.24 mill people die every yr on the world’s roads, and another 20 to 50 million sustain nonfatal injuries as a result of road traffic crashes. • In most regions of the world this epidemic of road traffic injuries is still increasing. • 80% of road traffic deaths occur in middle-income countries, which account for 72% of the world’s population, but only 52% of the world’s registered vehicles. • In India Between 1970 and 2011, the number of accidents increased by 4.4 times, with 9.8 times increase in fatalities and 7.3 times increase in the number of persons injured
Risk Factors Factors influencing exposure to risk Factors influencing crash involvement Factors influencing injury severity Factors influencing post-crash injury outcome
Factors influencing exposure to risk • Rapid motorization • Motor vehicles • Main contributing factors for the increase in global road crash injury • Buses and trucks are a major mode of travel • In New Delhi, buses and trucks are involved in almost two thirds of crashes involving vulnerable road users, and these people make up over 75% of all road traffic deaths. • Motorized two-wheeled vehicles • Non motorized Traffic
Factors influencing exposure to risk • Demographic Factors- • Fluctuations in the relative sizes of different population groups • physical vulnerability • Transport, land use and road network planning • The degree of physical exercise undertaken by individuals, and the volume of road traffic crashes and injuries
Increased need for travel • Choice of less safe forms of travel
Risk factors influencing crash involvement • Speed • Core of the road injury problem • Influencesboth crash risk and crash consequence
Pedestrians and cyclists- • The absence of separate pedestrian and cyclist facilities, such as footpaths or cycle tracks, creates a high risk for these road users. • If separation is not possible, road management and vehicle speed management are essential. • At speeds of less than 30 km/h, pedestrians and cyclists can mix with motor vehicles in relative safety • Young drivers and riders- • Young men in their first few years of driving, have higher rates of crash involvement than women. • Thrill seeking behaviour • over-confidence • less tolerance of alcohol excess • inappropriate speed
Alcohol • Age of drivers- Teenagers with BAC of 0.03 g/dl carrying two or more passengers were 34 times more at risk of a crash than drivers aged 30 years. • Severity of crashes- - each 0.02% increase in BAC doubled the risk of involvement in a fatal crash.
Medicinal and recreational drugs • Driver fatigue
Crash Risk • Probability of a crash involving an injury is proportional to the square of the speed. • The probability of a serious crash is proportional to the cube of the speed. • The probability of a fatal crash is related to the fourth power of the speed. • Increase of 1 km/h in mean traffic speed results in a 3% increase in the incidence of injury crashes. • At levels above 50 km/h, a decrease of 2% in the number of crashes for every 1 km/h reduction in the average speed
Severity of crash injuries- • As ∆V from increases about 20 to 100 km/h, the probability of fatal injuries increases from 0to almost 100% • Serious injury for belted front-seat occupants is three times at 30 miles/h and four times as great at 40 miles/h compared with the risk at 20 miles/.
Risk factors influencing injury severity • Lack of in-vehicle crash protection- • Most accidents occur outside the car, with those affected being pedestrians, cyclists, motorized two-wheeled vehicle riders • Non-use of crash helmets by two-wheeled vehicle users • reduce fatal and serious head injuries by between 20% and 45% • Non-use of seat-belts and child restraints in motor vehicles
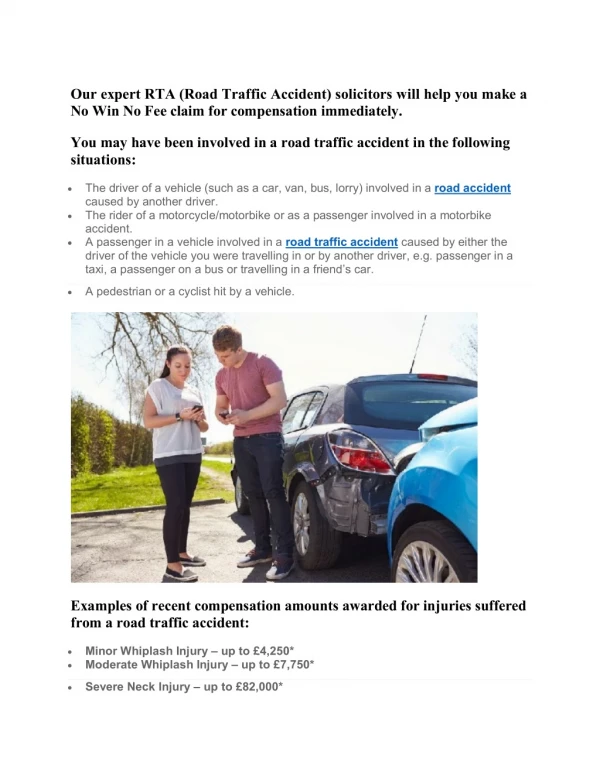
Risk factors influencing post-crash injury outcome • 50% of deaths from road collisions occurred before reaching to hospitals. • Pre Hospital Factors • No access to basic form of emergency medical service. • Many victims do not possess social security, health cover or life insurance therefore lack access to hospital care. • Hospital care factors- • Lack of trained expertise in trauma care, equipment- essential low-cost and reusable equipment • poor organization rather than the cost.
Road safety as a social equity issue • High impact on the poor and vulnerable in society. • costs of prolonged medical care • loss of the family breadwinner • cost of a funeral • loss of income due to disability can push families into poverty.
Haddon’s Matrix • Road transport as an ill-designed, “man-machine” system needing comprehensive systemic treatment • three phases of the time sequence of a crash event – pre-crash, crash and post-crash • epidemiological triad of human, machine and environment • nine-cell Haddon Matrix models a dynamic system • each cell of the matrix allowing opportunities for intervention to reduce road crash injury.
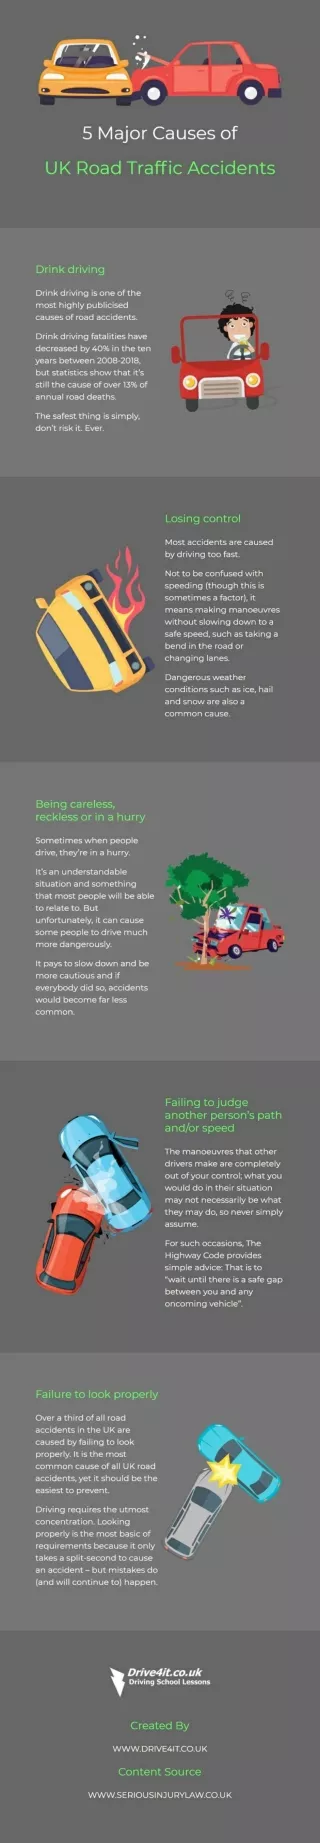
6. Road Traffic Accidents, Prevention and Control • RTA deaths and serious injuries are to a great extent preventable, since the risk of incurring injury in a crash is largely predictable. • The strategies address the three prime elements of the traffic system – • Vehicles • road users • road infrastructure
Managing exposure to risk through transport and land-use policies • Reducing motor vehicle traffic • Efficient land use- • spatial distribution of origins and destinations of road journeys • patterns of urban growth • size of residential areas. • Safety impact assessments of transport and land-use plans- • improving mobility • reducing congestion • improving the environment • Providing shorter, safer routes, • Trip reduction measures.
Encouraging use of safer modes of travel • Improved mass transit systems • better coordination between different modes of travel • shelters for bicycle • allowing bicycles to be carried on board trains, ferries and buses • discourage private car use in favour of public transport • Minimizing exposure to high-risk scenarios • Preventing traffic mixing • Giving priority to higher occupancy vehicles • Restrictions on speed and engine performance of motorized two-wheelers • Increasing the legal age for use of motorized two-wheelers • Strict driver licensing systems
Incorporating safety features into road design • Segregation of traffic • Traffic-calming measures, • Safety audits, • Crash-protective roadsides, • Crash cushions, • Remedial action at high-risk crash sites • Providing visible, crash-protective, “smart” vehicles • Daytime running lights for cars(20%), • High-mounted stop lamps in cars(15% and 50% crashe reduction in Norway and United States), • Crash-protective vehicle design • Setting and securing compliance with road safety rules
Setting and enforcing alcohol impairment laws • The risk of crash starts to increase significantly at BAC levels of 0.04 g/dl • In India legal BAC level is 0.03gm/dl. • Minimum drinking-age laws • Drivers’ hours of work in commercial and public transport • 20–30% of crashes in Europe & US involving commercial road vehicles. • 60% of the overall costs of traffic crashes are borne by society
Setting and enforcing seat-belt and child restraint use • Mandatory seat-belt use
Child restraints • Bicycle helmets • Reduce the risk of head/brain injury by 63-88% • Motorcycle helmets • In Malaysia, legislation(1973)- reduction of 30% in motorcycle deaths • In Thailand -head injuries decreased by 41.4% and deaths by 20.8% • The role of education, information and publicity • always featured as the mainstay of prevention.
Delivering post-crash care • Chain of help for patients injured in road crashes • “No Golden Hour” • Pre-hospital care-Role of lay bystanders • contacting the emergency service • put off fire • secure the scene • first aid, • external haemorrhage could be avoided • Access to the emergency medical system • Improvement of hospital settings by human resource, physical resource, organization of trauma care. • Rehabilitation
Recent Road safety initiatives by Government of India • The Government has already approved a National Road Safety Policy. • The Government has constituted National Road Safety Council as the apex body to take policy decisions in matters of road safety • The Ministry has adopted a multi pronged strategy to address the issue of road safety based on four Es of Road Safety. • Road Safety Framework plan has been praposed for the Twelfth Five Year Plan • Multi-Pronged Strategy to improve road safety
Present Status • NHAI has identified eleven locations for establishing, operating and maintaining Wayside Amenities with various entrepreneurs and out of which 4 are functional. • NHAI is identifying more Potential Sites along East West Corridor between Porbandar to Lucknow and North – South Corridor between Kanyakumari to Hyderabad to develop Wayside Amenities to facilitate the Road Users. Call Centre • No. of Ambulances in place 223 • No. of Tow away cranes 198 • No. of Route Patrol vehicles 229
Success Story • Vision Zero- traffic safety policy, Sweden, in the late 1990s. It is based on four elements: ethics, responsibility, a philosophy of safety, and creating mechanisms for change • system should be able to take account of human failings and absorb errors in such a way as to avoid deaths and serious injuries • limiting factor of this system is the human tolerance to mechanical force • chain of events leading to death/serious injury can be broken at any point. A tool for all • Relevant to any countries that aims to create a sustainable road transport system. • basic principles can be applied to any type of road transport system, at any stage of development. • Adopting Vision Zero means avoiding the usual costly process of trial and error,
References • World report on road traffic injury prevention. Geneva: World Health Organization, 2004. • Global Status Report on Road Safety, Time for Action. Geneva: World Health Organization, 2009. • Road Accidents in India. New Delhi: Transport Research Wing, Ministry of Road Transport and Highways, 2011. • Road Accidents in India. New Delhi: Transport Research Wing, Ministry of Road Transport and Highways, 2009.