Download

1 / 24
240 likes | 363 Views
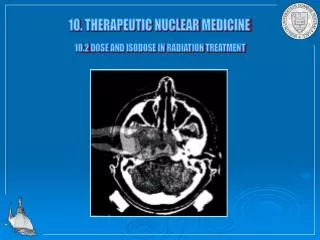
10. THERAPEUTIC NUCLEAR MEDICINE. 10.2 DOSE AND ISODOSE IN RADIATION TREATMENT. At the position d max of maximum energy loss of radiation, the number of secondary ionizations products peaks which in turn maximizes the dose at that location.

E N D
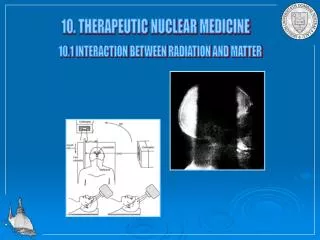
10. THERAPEUTIC NUCLEAR MEDICINE 10.2 DOSE AND ISODOSE IN RADIATION TREATMENT
At the position dmaxof maximum energy loss of radiation, the number of secondary ionizations products peaks which in turn maximizes the dose at that location. The dose is denned (see section on dosimetry) as total energy loss of radiation per mass. It can be formulated in terms of the activity A(t) (number of incident particles/second in cases of external beam treatment N(t))and energy loss or stopping power dE/dx. The total absorbed dose D(t) after a period t of irradiation is expressed in terms of number of particles N(t), total amount of energy lost ER, and irradiated area A: with m, V, and as mass, volume, and density of the exposed organs. This results in a absorbed dose D(t,d) after an irradiation period t at a certain depth d:
100% 75% A The absorbed dose at a certain depth d is directly proportional to the stopping power 1/ dE/dx ! Within the area A each point at a certain depth d receives the same dose ISODOSE.
[cm2/g] The average dose due to energy loss of radiation within a depth d over a period t is: The dose is directly proportional to the transfer and absorption coefficients which change with depth.
The dose distribution is less well defined compared to particle beams.
Within the area A each point at a certain depth d receives the same dose ISODOSE. Isodose profiles are plotted in terms of the percentage depthdose %DD because absolute dose measurements are difficult. The percentage depth dose is the absorbed dose at a given depth d expressed as a percentage of the absorbed dose at a reference depth dmax along the central axis of the beam. In figure above the percentage depth dose at point A is 75 %. Isodose charts are usually plotted in increments of 10 %. They depend on the beam geometry and the various absorption effects within the body tissue.
Examples of isodose profiles For electron beam the percentage depth dose increases with depth, the maximum range depends on the initial energy of the electron beam. The isodose profile widens rapidly due to wide angle scattering.
For heavy ion beam the profile remains well defined but the percentage depth dose increases rapidly at well localized position due to Bragg curve behavior plus decay radiation from on-line produced activities.
For -radiation the percentage depth dose peaks at small depths but ranges deeply into the tissue proportional to the absorption coefficient.
Cobalt 60 4 MeV 6 MeV 15 MeV The angle scattering is small, the beam profile and therefore the isodose profile remains well defined.
A carefully designed treatment plan is necessary to maximize the dose at the tumor location while minimizing the dose in the surrounding body tissue! Notice, while tumor might get maximum dose, the surrounding tissue may be exposed to at least 50 % of it which may cause problems.
Dose calculation should consider the following aspects • geometry of treatment • energy loss effects • straggling and widening of beam • backscatter
Treatment plan needs to be carefully designed, should rely on careful localization of tumor with modern imaging techniques (CT, MRI). Dose and dose losses should be simulated (three dimensional simulation).
B A C D
Typically, the prescribed dose depends on the size of the tumor and the specific organ which has been effected. The prescribed total doses range between 40 Gy to 70 Gy. For external beam therapy the dose will be administered over a period of five to six weeks with a daily dose ranging between 1.9 and 2.2 Gy/day (five days a week). The treatment time depends on the intensity of the radiation source!
For brachytherapy a radioactive source is implanted in a location near the tumor. Therefore the radiation is constant until the desired dose has been reached.
For calculating the dose to be delivered geometrical aspects and backscattering have to be taken into account. Critical is the source-surface distance SSD which determines intensity losses between source and body. d is the depth of the tumor location! A dose rate of DR1 = 1.17 Gy/min delivered over a distance of SSD1+ d = 80.5 cm reduces over a distance of SSD2+ d = 100 cm to: Substantial losses can occur by back scattering, the backscattered radiation will increase the dosage in the surrounding body tissue. Therefore a further modification has to be introduced by subtracting the amount of backscattered radiation BS in the body tissue.
The backscatter is defined as the ratio of scattered dose at depth d of body tissue to the scattered dose in air at the same length d.
To optimize treatment often multiple beam treatment is applied. This approach maximizes the dose at the location of the tumor and minimizes the dose in the surrounding body tissue.
Alternative options are the introduction of wedges which allow beam attenuation and absorption to shape the radiation field for optimal treatment.