Download
1 / 22
220 likes | 350 Views
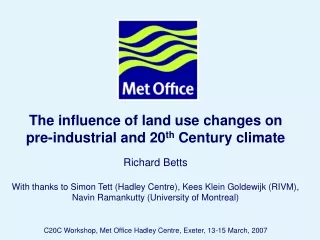
The influence of land use changes on pre-industrial and 20 th Century climate. Richard Betts With thanks to Simon Tett (Hadley Centre), Kees Klein Goldewijk (RIVM), Navin Ramankutty (University of Montreal) C20C Workshop, Met Office Hadley Centre, Exeter, 13-15 March, 2007.

E N D
The influence of land use changes on pre-industrial and 20th Century climate Richard Betts With thanks to Simon Tett (Hadley Centre), Kees Klein Goldewijk (RIVM), Navin Ramankutty (University of Montreal) C20C Workshop, Met Office Hadley Centre, Exeter, 13-15 March, 2007
Historical reconstructions of land use SAGE: Centre for Sustainability And the Global Environment, University of Wisconsin, USA HYDE: HistorY Database of the Environment, RIVM, Netherlands
How has land cover change affected climate through biogeophysical effects? • Performed two 20-year HadAM3 GCM simulations with different land surface parameter input fields • (i) 1990 vegetation • (ii) Potential natural vegetation • vegetation dataset at 1º resolution • in gridcells which are partially deforested in 1990, extrapolate remaining natural vegetation • in gridcells which are totally deforested in 1990, replace 1990 vegetation with natural vegetation from a model (Woodward et al, 1995)
Differences in land surface parameter fields: 1990 (ACTual) - “Natural” (NAT) veg
Differences in land surface parameter fields: 1990 (ACTual) - “Natural” (NAT) veg
Simulated annual mean 1.5m temperature difference (K): 1990 - “Natural” vegetation
Simulated seasonal differences in 1.5m temperature (K): 1990 (ACTual) - “Natural” (NAT) veg
Simulated seasonal differences due to albedo change alone “ALBNAT” = albedo of natural veg
Changes in fraction of land disturbed by agriculture Ramankutty & Foley 1999 Klein Goldewijk 2000
Effects of pre-industrial (1750) vs. current (1990) land use in HadCM3 OAGCM Surface temperature difference (K), “NATURAL” simulation – “CONTROL” simulation “NATURAL”: land use = 1750, CO2 = 277.5 ppmv, historical solar forcing and volcanic aerosol “CONTROL”: land use = 1990, CO2 = 289.6 ppmv, solar irradiance = 1365 Wm-2, volcanic aerosol = average 20th Century values Tett et al, 2006
Snow cover feedbacks due to land use effects on pre-industrial climate Snow cover difference (%), “NATURAL” simulation – “CONTROL” simulation “NATURAL”: land use = 1750, CO2 = 277.5 ppmv, historical solar forcing and volcanic aerosol “CONTROL”: land use = 1990, CO2 = 289.6 ppmv, solar irradiance = 1365 Wm-2, volcanic aerosol = average 20th Century values Tett et al, 2006
Global radiative forcings at 2005 relative to 1750 Source: IPCC
Simulating radiative forcing due to surface albedo change • Use radiative transfer model (Edwards and Slingo) in HadAM3 GCM • 6 sets of radiation calculations (only one feeds back to climate) • Simulate surface albedo and outgoing SW flux with vegetation state for: • Potential natural vegetation (PNV) • 1750 • 1850 • 1900 • 1950 • 1990 - only 1990 surface SW budget feeds back to climate • Difference in outgoing SW flux between any date and PNV is radiative forcing (RF) relative to PNV • Easy to calculate RF relative to any reference state (eg: 1750 as usually examined by IPCC)
Surface albedo forcing (Wm-2): 1750 - “natural” Global mean: - 0.06 Wm-2
Surface albedo forcing (Wm-2): 1850 - “natural” Global mean: - 0.10 Wm-2
Surface albedo forcing (Wm-2): 1900 - “natural” Global mean: - 0.14 Wm-2
Surface albedo forcing (Wm-2): 1950 - “natural” Global mean: - 0.18 Wm-2
Surface albedo forcing (Wm-2): 1990 - “natural” Global mean: - 0.24 Wm-2
1990 forcing relative to “natural” global mean: -0.24 Wm-2 1990 forcing relative to 1750 global mean: -0.18 Wm-2 Wm-2
Conclusions • Model results suggest that past deforestation has affected global climate mainly through surface albedo change • Current major temperate agricultural areas may be approximately 1K cooler in annual mean than they would otherwise be if still under potential natural vegetation, due to increased surface albedo following deforestation • Much of this regional cooling likely to have occurred since Industrial Revolution • Local and global radiative forcings due to land use change continue to increase over time between 1750 and 1990 • Land use change therefore may influence 20th Century climate change