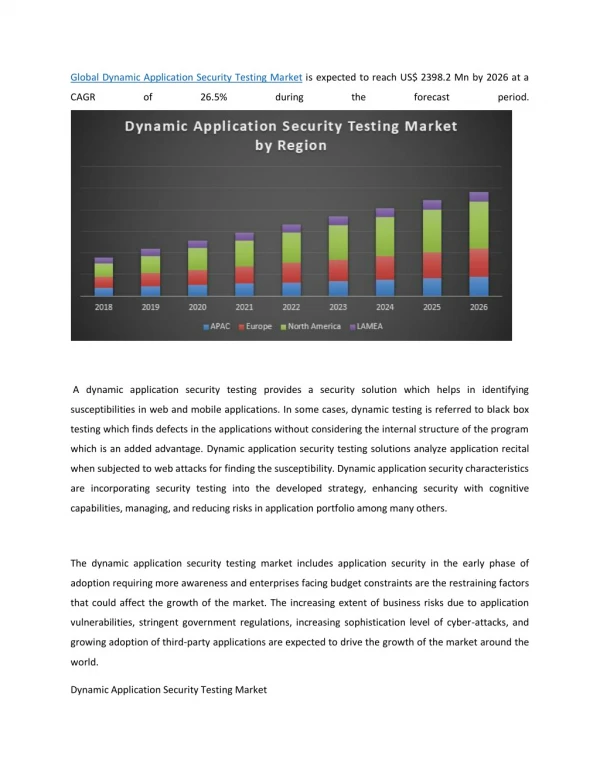
Download
1 / 19
190 likes | 443 Views
Global Application Performance Testing at NYU. TESTING FRAMEWORK Testing Types Service Lifecycle Testing Infrastructure. Component, etc. (do the software parts work alone and together as specified) 2. User/Functional (is it usable, does it perform the business operations correctly).

E N D
TESTING FRAMEWORK Testing Types Service Lifecycle Testing Infrastructure Component, etc.(do the software parts work alone and together as specified) 2. User/Functional(is it usable, does it perform the business operations correctly) 3. Performance/Latency(how does it work at a distance) 4. Load(how does it work under load) 5. User Experience(how does it work for individual users or groups of users, especially at different locations, different browsers, etc. Development Pre-Rollout Operations Testing tools, standards and techniques
Common Performance Issues • Network • Network Bandwidth • Network Latency • Jitter • Shared Infrastructure • Response times are highly variable • Performance depends on the load on other applications and network traffic • Web page/Application Issues • Web and other applications not tuned for latency, lack of TCP/IP optimization • Poor or no server/client caching
Two forms of Testing/Monitoring Latency Simulator and Actual testing from different locations End-User Experience performance
Methodology • Service Manager defines a typical usage scenario with target response times • Understand response time targets • What is “acceptable”, “tolerable”, and “frustrating” for users • When targets are not known, assume 120% of response times from NY to be “acceptable” • Measure response times of the scenario in New York • Repeat the same test from global location and compare • Remotely login (from NY) to a test machine at global location • Engage test resources at global location when needed • Where applicable, test a combination of OS & Browsers • Analyze the report and provide recommendations • Repeat test, if necessary
Testing Tools Used • RTI – RootCause Transaction Instrumentation for Internet Explorer (IE) • Provides a non-intrusive way to record transactions initiated with IE and then analyzes end-user response times to quickly identify the root cause of the slowness. • Firebug – Web development tool (plugin) for Firefox • For editing, debugging, and monitoring CSS, HTML, and JavaScript. • Also for monitoring network activity and analyzing response times. • Web Inspector – Web development tool for Safari • Wireshark – network protocol analyzer • Allows for capturing network packets and analyzing their timings • ySlow – Firefox add-on integrated with Firebug • Web page analyzer • Offers suggestions for improving page’s performance based on predefined or user defined rule sets.
Long Distance Performance Simulator Anue Systems Profiles created for Global Sites on NYU network
Application Performance at a Glance (last year) Retest after performance enhancements Echo360 High JPEG 2000 (Afgan Digital Library) Videoconferencing JPEG 2000 (Afgan Digital Library) Xythos (Webspace) Xythos ( Files 2.0) Library Streaming Services (HIDVL) Kaltura Library Streaming Services (HIDVL) Retest after performance enhancements Faculty Digital Archive AP Workflow E-mail Alex Hyperion Medium StarRez Demand on Data Transfer People Admin Sakai / iTunes Advance Fundraising Remedy Emergency Notification (MIR3) Blackboard Studio Abroad NYU eVita BobCat Audio Streaming Services Knowledgbase Student Health Services I5-FTP NYU Wiki NYU Blog InfoEd ProjTrak FAME BRIO NYU Lists PASS HRIS HR Reporting SpecID Card Albert One Card Low SIS NYU Home Frustrating Acceptable Tolerable User Experience
WebApp Performance Tool Dashboards Reports Queries & Analyze
What is it? • Hardware device (moving to software) • Connected to the F5 Span Port • Captures a copy of the traffic from F5 switch, according to the watch points set up TrueSight Device Web Server F5 Switch Internet / Network User
What information does it capture? Host Time Network Time Start /End Time SSL Handshake Time Captures performance metrics of HTTP (and HTTPS) web traffic Can capture specific information about the request “Watch points” can be put on specific transactions or pages
What can we do with this information? Analyze performance issues Troubleshoot client and network issues View dashlets to show real-time traffic performance View highly customized reports Automatically email alerts based on defined thresholdsThis has been a game changer for us in identifying specific issues
Remediation Optimizing webpages, applications Tuning network to ensure we are getting full bandwidth WAN Acceleration so we don’t have to do TCP tuning for all clients and servers QoS to ensure appropriate bandwidth use for some applications
Learning and New Practices • Learnings • As we always knew, performance testing is hard and complicated, involving all parts of IT • Most app builders assume the user and the system are on a LAN or at least on a short-distance WAN • We now understand our apps much better than we did • New Practices • We test everything this way before going live • We set watch points on our end-user app tool to watch how performance is doing • We work with cloud vendors on how they test our instances before we select, before we go llive, etc.