Download

1 / 23
230 likes | 410 Views
University of Cassino – Dept. DAEIMI - Dipartimento di Automazione, Elettromagnetismo, Ingegneria dell’Informazione e Matematica Industriale. A DATA MINING APPROACH TO CHANGE DETECTION USING SPECTRAL CHANGE MEASURING FEATURES. Authors Simona Ruscino - s.ruscino@unicas.it

E N D
University of Cassino – Dept. DAEIMI - Dipartimento di Automazione, Elettromagnetismo, Ingegneria dell’Informazione e Matematica Industriale A DATA MINING APPROACH TO CHANGE DETECTION USING SPECTRAL CHANGE MEASURING FEATURES Authors Simona Ruscino - s.ruscino@unicas.it Ciro D’Elia - delia@unicas.it
Contents ESA-EUSC 2011 - Joint Research Center • Introduction to the Change Detection context • The proposed algorithm: • Theoretical background • Processing on raw data and structure of change detector • IPAINT framework • Processing on ingested data • The ingestion phase • The shape–based change detector • Data processing dataset • Experimental Results: • From raw to ingested • The change spectral features • From the change features to the change map • Evaluation of performances • Conclusions • Future Works
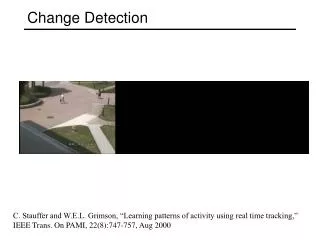
Introductionto the changedetectioncontext ESA-EUSC 2011 - Joint Research Center • Change analysis is in essence a spatial comparison of two or more land covers of the same geographical area produced from remotely sensed data that are recorded at different times. [2] • A good change detection algorithm: • should be able to detect the significant changes occurred • produces a change mask • In [15] we presented a new change detection algorithm based on the extraction of two complementary features measuring changes occurred between two remotely-sensed multispectral images acquired on the same area but at different times. • In this paper the proposed features are used in an IIM context in order to introduce an automated procedure to detect changes for a database of images: • Database ingested data, instead of raw data like in [15] • Object-based representation for data instead of pixel based like in [15] • Significant reduction in computational complexity with a small change in performances
The change detection algorithm: theoretical background (1/2) X’s projection on Y’s direction, that represents the reference direction X’s projection on the orthogonal space to the reference direction Two corresponding spectral vectors make an angle that is not zero , whose value gives the spectral change information HP: No preferred change direction ESA-EUSC 2011 - Joint Research Center • Significant changes are associated to cosine values being small, which correspond to high value for the spectral angle
The change detection algorithm: theoretical background (2/2) ESA-EUSC 2011 - Joint Research Center • Nevertheless, an angle equal to zero does not mean that no change has occurred, because there might have been a variation only in image brightness so the change vector has just the component along the reference direction. • Significant changes are associated with values of BCF that are far from 1.
Processing on raw data • Co-registration • Geo-referencing • Radiometric correction Pre-processing • Change detection • Areas of interest on change map Change Processing • Change detection is performed on a per-pixel basis. ESA-EUSC 2011 - Joint Research Center • In [15] the following processing system has been used :
IPAINTframework (1/2) • Segmentation, Shape extraction and Features extraction are performed. • Object-based representation for the image • Data can be prepared once and then used for different types of processing Application Independent Processing SIGNIFICANT REDUCTION IN COMPUTATIONAL COMPLEXITY • It changes according to the specific type of processing • Image compression, restoration, object based classification, change detection are some of the possible applications the ingestion phase could be used with. Application Dependent Processing ESA-EUSC 2011 - Joint Research Center
IPAINTframework (2/2) • IPAINT framework works on optical data as well as SAR data • The segmentation is achieved applying an a-priori MRF (Markov Random Field) model which takes into account the spatial dependencies in the image in term of the conditional probability that a pixel belongs to a class given the classes of its neighbors. This model, called TS-MRF (Tree-Structured Markov Random Fields), consists in segmenting the image in smaller regions using a binary tree structure in which the tree leaves partition the image in a certain number of disjoint regions. • After the segmentation process, the image is divided in a large number of homogeneous elementary segments belonging to the same cluster; a shape extraction procedure follows in order to arrange the image in connected regions, called shapes, represented in vector form. • Each shape is characterized by a set of features related to image’s geometrical, spectral and contextual properties. ESA-EUSC 2011 - Joint Research Center
The Ingestionphase • Two multispectral co-registered images acquired on the same area but in different times have been considered • They are segmented using the TS-MRF algorithm • A number of shapes (vector segments that put groups of pixels together) is extracted • For each shape geometrical, spectral and contextual descriptors are extracted, and shape mean descriptor has been considered. ESA-EUSC 2011 - Joint Research Center
Processing on ingested data • Image Segmentation • Shapes’ extraction with descriptors • Radiometric correction Pre-processing • Change detection • Areas of interest on change map Change Processing Ingestion Application dependent processing Application independent processing ESA-EUSC 2011 - Joint Research Center • In this paper we present the following processing system using the change detection features proposed in [15] in the context of Image Information Mining.
The Shape-basedChange Detector • A merge of the two segmentation maps produced by the ingestion step is performed • A new segmentation map is obtained, for which the shape mean information has been preserved • The spectral change features are calculated • Classification of changes is performed • Three different types of classification techniques have been used : • Support Vector Machine, SVM • Learning Vector Quantizer, LVQ • Dynamic Learning Vector Quantizer, DLVQ • The output of the entire change detection procedure is a change classification map made up by two classes: • Changed class, representing the changed pixels • Unchanged class, representing the pixels that have not changed ESA-EUSC 2011 - Joint Research Center
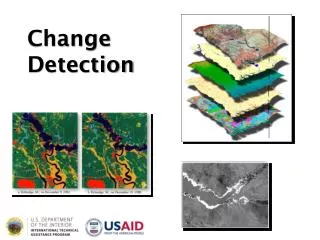
Data processing: dataset ESA-EUSC 2011 - Joint Research Center • The previously described procedure has been implemented on a dataset made up by three multispectral co-registered images of the city of Rome (Italy) acquired in 2002, 2008 and 2010 respectively. • They are QuickBird images having 1 meter spatial resolution in pan-sharpened mode. • These images have been organized in couples, i.e. 2002-2008, 2002-2010 and 2008-2010, and the change detection procedure has been tested on each couple.
Data processing: datasetWater Facility Project ESA-EUSC 2011 - Joint Research Center • The considered dataset has been acquired within a project dealing with water facility surveillance, that we are developing in collaboration with the DiMSaT Department of the University of Cassino and the authority managing the waterworks of Rome. • We would like to thank both.
ExperimentalResults 2002 2008 ESA-EUSC 2011 - Joint Research Center • For shortness, only the results concerning the 2002-2008 couple will be shown. • We have started from two 4-bands co-registered images, whose RGBs are shown below:
Experimental Results: 2002-2008from raw to ingested 2002 2008 ESA-EUSC 2011 - Joint Research Center
Experimental Results: 2002-2008the change spectral features SVM LVQ DLVQ ESA-EUSC 2011 - Joint Research Center
ExperimentalResults: 2002-2008Performances ESA-EUSC 2011 - Joint Research Center • Percentage of pixels being correctly classified • Some specific changes have been brought to our attention:
ExperimentalResults: 2002-2008Performances - SVM • RR=95.16% for raw data • RR=93.87% for ingested data • Computational Complexity: 2.2% (classification) We have a 2% decrease in Recognition Rate but the computational complexity decreases of 97.8% Raw Ingested ESA-EUSC 2011 - Joint Research Center
ExperimentalResults: 2002-2008Performances - LVQ • RR=94.20% for raw data • RR=91.51% for ingested data • Computational Complexity: 2.2% (classification) We have a 2% decrease in Recognition Rate but the computational complexity decreases of 97.8% Raw Ingested ESA-EUSC 2011 - Joint Research Center
ExperimentalResults: 2002-2008Performances - DLVQ • RR=94.45% for raw data • RR=92.97% for ingested data • Computational Complexity: 2.2% (classification) We have a 2% decrease in Recognition Rate but the computational complexity decreases of 97.8% Raw Ingested ESA-EUSC 2011 - Joint Research Center
Experimental Results: 2002-2008Performances Evaluation ESA-EUSC 2011 - Joint Research Center • The values of Recognition Rate obtained on ingested data are comparable with the ones obtained for raw data • Applying the proposed change detection technique on different resolution and processing levels does not bring a significant loss in performances • We registered a 97.8% reduction in computational complexity in favor of ingested data, which corresponds to a small reduction in the values of recognition rate from the case of raw data to the case of ingested data.
Conclusions ESA-EUSC 2011 - Joint Research Center • An automated procedure to detect changes has been presented; it’s built on a change detection algorithm extracting two complementary spectral change features: • A function of the spectral angle made by the corresponding spectral vectors in the images that have to be compared, that measures a change occurred in pixels’ spectral content • The Brightness Change Factor (BCF), that measures the change occurred in pixels’ radiance value • The proposed features contain sufficient information in order to represent changes through a classification system, which is able to recognize the changed pixels from the unchanged ones without any knowledge about the land-cover/land-use of the observed scene with acceptable performances. • Working on ingested data brings to a 2-3% reduction in performances vs a 97.8% reduction in computational complexity.
Future Works ESA-EUSC 2011 - Joint Research Center • Realization of a similar change detection automated procedure for hyper-spectral data as well as SAR data • Usage of the proposed procedure on two images acquired on the same scene but by different high resolution sensors • Development of a web platform through which the remote management of experiments and results could be possible • Detection of specific pre-established land-covers. • Per-object performances evaluation\comparison