Download
1 / 50
610 likes | 1.08k Views
MEASURING CLIMATE CHANGE. By: Jayashree Khandekar Coordinator, Sr. Sec. Section DAV Public School, New Panvel. The climate system is a complex, interactive system consisting of the atmosphere, land surface, snow and ice, oceans and other bodies of water, and living things.

E N D
MEASURING CLIMATE CHANGE By: JayashreeKhandekar Coordinator, Sr. Sec. Section DAV Public School, New Panvel
The climate system is a complex, interactive system consisting of the atmosphere, land surface, snow and ice, oceans and other bodies of water, and living things.
The atmospheric component of the climate system is what we generally refer to as climate: climate is often defined as ‘average weather’.
Climate is usually described in terms of the mean and variability of temperature, precipitation and wind over a period of time, ranging from months to millions of years (the classical period is 30 years.)
Instruments Used When Measuring Climate Change There are a number of key factors in measuring climate change and hence there is no single instrument measuring it.
Instruments Used When Measuring Climate Change The range of instrumentation used to observe and measure climate is truly amazing. There are thousands of measuring devices spread across the globe, on land, under the sea and in the air.
Measure What????? • Temperature • Precipitation • Biomass • Sea Level • Solar Activity • Volcanic Eruptions • Chemical composition of air or water
Temperature When measuring climate change, this is a primary element and can be measured or reconstructed for the Earth's surface, and sea surface temperature (SST).
Air temperature can be measured with a thermometer, invented by Italian mathematician Galileo Galilei in about 1592. The basic design - a fluid-filled hollow glass bulb attached to a stem with a thread-like bore - is still used today.
The Electronic Maximum-Minimum Temperature Sensor (MMTS) has to a large extent replaced the old thermometer. An electronic temperature sensor that replaces glass thermometers is housed in a white case to reflect sunlight and has vents all around so that the air flows freely over the temperature sensor inside.
Upper Air Climate Change- Temperature The Radiosonde is a balloon-borne instrument platform with a battery powered device (new versions are little larger than a softdrink can) which relays information to a sensitive ground receiver at a tracking station near the launch site.
The radiosonde contains instruments capable of making direct in-situ measurements of air temperature, humidity and pressure with height, typically to altitudes of approximately 30 km. These observed data are transmitted immediately to the ground station by a radio transmitter located within the instrument package.
FROM AN AIRCRAFT NASA maintains an airborne sciences division, which comprises high altitude, high-tech scientific fleet. research aircraft. With aircraft such as this, scientists can get inside the clouds of a developing hurricane.
Perhaps NASA’s most unusual aircraft is the ER-2, a research version of the U-2 spy plane. Its long, narrow wings distinguish this aircraft. It flies at an altitude of 70,000 feet - so high that the single pilot must wear a pressurized spacesuit. From these great heights, the aircraft flies over the dome-like top of hurricanes, and measures amongst other things climate change temperature.
The Sea and Climate Change - Temperature Since 2002, new measurements have come from an international collaboration called Argo, a global array of 3,000 free-drifting floats that measure temperature and salinity of the ocean’s upper 2,000 meters. An Argo profiling float cycling through the water column
The Sea and Climate Change - Temperature Argo is a major contributor to the Climate Variability and Predictability Experiment (CLIVAR) project and to the Global Ocean Data Assimilation Experiment (GODAE). Measuring salinity of the sea water
Precipitation Precipitation (rainfall, snowfall etc) offers another indicator of relative climate variation and may include humidity or water balance, and water quality.
Measuring precipitation covers rain, hail, snow, rime, hoar frost and fog, and is traditionally measured using various types of rain gages such as the non-recording cylindrical container type or the recording weighing type, float type and tipping-bucket type.
Generally, standard gauges measure precipitation at or near the ground, and are observed at least once a day. The sizes of the gauges are made big enough to collect more than the average one-day or maximum 1-2 hour precipitation which differs according to various climatic conditions.
Automated Rain Gauge There are electronic rain gauges that measures rain fall, and are also self emptying and frost proof. The basic idea is the rain collector’s measuring spoon being automatically tipped and emptied when the pre-adjusted water weight has been reached.
Measuring Precipitation with Weather Radar A weather radar is a type of radar used to locate precipitation, calculate its motion, estimate its type (rain, snow, hail, etc.), and forecast its future position and intensity. The data can be analyzed to determine the structure of storms and their potential to cause severe weather.
Measuring Precipitation Using Weather Satellites These meteorological satellites see more than clouds and cloud systems. City lights, fires, effects of pollution, auroras, sand and dust storms, snow cover, ice mapping, boundaries of ocean currents, energy flows, etc., are other types of environmental information collected using weather satellites.
A disdrometer A disdrometer is an instrument used to measure the drop size distribution and velocity of falling hydrometeors. Some disdrometers can distinguish between rain, graupel, and hail. The uses for disdrometers are numerous. The latest disdrometers employ microwave or laser technologies. 2D video disdrometers can be used to analyze individual snowflakes.
Hail Pads A hail pad consists of a 12" by 12" square of Styrofoam covered in Heavy Duty Aluminum foil.
The new Laser Precipitation Monitor (LPM) measures the amount, intensity and type of precipitation with great accuracy. The system calculates intensity, volume (as water equivalent) and the spectrum of precipitation (diameter and velocity), the reduction to visibility in precipitation (MOR) and the radar reflectivity (Z)
Biomass Biomass and vegetation patterns may be discerned in a variety of ways and provide evidence of how ecosystems change to adapt to climate change.
Soil Monitoring These automated electronic monitoring systems have distinct advantages as they can be automated to collect data unattended. They can also collect numerous measurements each day, and do not require laboratory conditions to provide results
MODIS Enhanced Vegetation Index (EVI) map The above MODIS Enhanced Vegetation Index (EVI) map above shows the density of plant growth over the entire globe. The MODIS EVI gives scientists a new tool for monitoring major fluctuations in vegetation and understanding how they affect, and are affected by, regional climate trends.
Animal Tracking The use of Global Navigation Satellite Systems (GNSS) in animal tracking has become widespread. The recorded location data can be stored within the tracking unit or may be transmitted to a centrally located data store, or internet-connected computer, using an embedded cellular (GPRS), radio, or satellite modem.
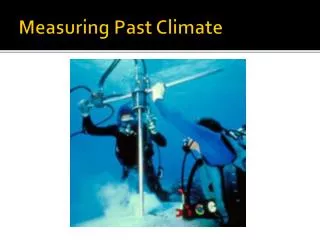
Sea Level Sea Level measurements reflect changes in shoreline and usually relate to the degree of ice coverage in high latitudes and elevations.
Measuring Sea Level Tides Over the past decade or so a network of high resolution monitoring stations have been established to provide the scientific community with information on sea levels. Measuring sea level in this way is an initiative known as the Sea Level Fine Resolution Acoustic Measuring Equipment (SEAFRAME), with monitoring stations throughout the South Pacific.
Measuring Sea Level – Satellites Since August 1992 the satellite altimeters have been measuring sea level on a global basis with unprecedented accuracy. The TOPEX/POSEIDON (T/P) satellite mission provided observations of sea level change from 1992 until 2005.
Solar Activity Solar Activitycan influence climate, primarily through changes in the intensity of solar radiation.
Measuring Solar Activity – Ground Based The Earth – Atmosphere Heat Balance
The Solar Radiation and Climate Experiment (SORCE) is a NASA-sponsored satellite mission that is providing state-of-the-art measurements of incoming x-ray, ultraviolet, visible, near-infrared, and total solar radiation.
Volcanic Eruptions Volcanic Eruptions, like solar radiation, can alter climate due to the aerosols that are emitted into the atmosphere and alter climate patterns.
Volcanic eruptions can contribute to the destruction of stratospheric ozone, and researchers are now suggesting that ice particles containing sulphuric acid from volcanic emissions may contribute to ozone loss.
Correlation Spectrometer (COSPEC) These instruments have been in use for more than twenty years and are used for measuring sulphur dioxide emission rates from various volcanoes around the world.
Infrared Carbon Dioxide Analyzer (LI-COR) Use of a small infrared carbon dioxide analyzer (LI-COR) has recently become a standard method for measuring carbon dioxide emission rates at restless volcanoes.
Fourier Transform Infrared Spectrometer (FTIR) Volcanoes emit gases both during and between eruptions, and measuring gas composition and flux is important in understanding magma dynamics and eruption style. The FTIR is capable of analysing several gases simultaneously using an open-path or closed-path system.
Sampling Volcanic Gases The direct sampling of volcanic gases is very up close and personal, and is ideally suited for long term study of volcanos. This type of study produces detailed chemical analysis of specific fumaroles and vents.
Generally volcanic gases are collected by putting a chemically inert and heat resistant tube into a hot opening. The tube is allowed to heat up until any condensation in the tube has reached equilibrium with the escaping gases, usually about 5 minutes. Then, either a specially-designed evacuated-sample bottle or a flow-through sample bottle is attached to the collection tubing to gather the gases.
Continuous Volcano Monitoring Continuous volcano monitoring has the advantage of being able to detect both short-lived degassing events that occur in time periods lasting minutes to hours as well as long-term changes that occur over days to years.
Soil Efflux Measurements Soil efflux measurements can be made in areas where volcanic gases, typically CO2, rise from depth and discharge into the soil just beneath the surface.
Chemical composition of air or water Chemical composition of air or water can be measured by tracking levels of greenhouse gases such as carbon dioxide and methane, and measuring ratios of oxygen isotopes. Research indicates a strong correlation between the percent of carbon dioxide in the atmosphere and the Earth's mean temperature.
Chemical Climate Changes In The Ocean The international community has been developing a global observing system for ocean carbon over the last 10 years, using ships, buoys, and satellites to understand how the ocean absorbs atmospheric CO2.
Chemical Climate Changes In The Atmosphere Satellite-based ozone-measuring instruments can measure ozone by looking at the amount of ultraviolet absorption reflected from the Earth's surface and clouds.
Courtesy • Management of DAV Public School, New Panvel • IT Department, DAV Public School, New Panvel Source Google.com