Download

1 / 15
150 likes | 228 Views
P Values - part 2 Samples & Populations. Robin Beaumont 11/02/2012 With much help from Professor Chris Wilds material University of Auckland. probability. Aspects of the P value. P Value. sampling. statistic. Rule. A P value is a conditional probability considering a range of outcomes.

E N D
P Values - part 2Samples & Populations Robin Beaumont 11/02/2012 With much help from Professor Chris Wilds material University of Auckland
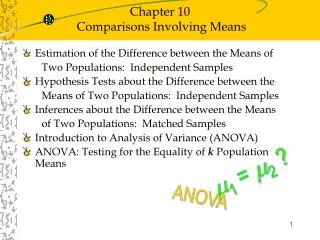
probability Aspects of the P value P Value sampling statistic Rule
A P value is a conditional probability considering a range of outcomes Resume Sample value P value = P(observed summary value + those more extreme |population value = x) Hypothesised population value
The Population Ever constant at least for your study! = Parameter P value = P(observed summary value + those more extreme |population value = x) Sample estimate = statistic
One sample Many thanks Professor Chris Wilds at the University of Auckland for the use of your material
Size matters – single samples Many thanks Professor Chris Wilds at the University of Auckland for the use of your material
Size matters – multiple samples Many thanks Professor Chris Wilds at the University of Auckland for the use of your material
We only have a rippled mirror Many thanks Professor Chris Wilds at the University of Auckland for the use of your material
Standard deviation - individual level Remember the previous tutorial But does not take into account sample size = t distribution = measure of variability within sample 'Standard Normal distribution' Area: Defined by sample size aspect ~ df 95% 68% Total Area = 1 SD value = 2 1 0 Between + and - three standard deviations from the mean = 99.7% of area Therefore only 0.3% of area(scores) are more than 3 standard deviations ('units') away. -
Sampling level -‘accuracy’ of estimate Talking about means here We can predict the accuracy of your estimate (mean) by just using the SEM formula. From a single sample = 5/√5 = 2.236 SEM = 5/√25 = 1 From: http://onlinestatbook.com/stat_sim/sampling_dist/index.html
Example - Bradford Hill, (Bradford Hill, 1950 p.92) All possible values of mean • mean systolic blood pressure for 566 males around Glasgow = 128.8 mm. Standard deviation =13.05 • Determine the ‘precision’ of this mean. • SEM formula (i.e 13.5/ √566) =0.5674 • “We may conclude that our observed mean may differ from the true mean by as much as ± 1.134 (.5674 x 2) but not more than that in around 95% of samples.” page 93. [edited] 125 126 127 128 129 130 131 x
We may conclude that our observed mean may differ from the true mean by as much as ± 1.134 (.5674 x 2) but not more than that in around 95% of samples.” That is within the range of 127.665 to 129.93 The range is simply the probability of the mean of the sample being within this interval P value = P(observed summary value + those more extreme |population value = x) P value of near 0.05 = P(getting a mean value of a sample of 129.93 or one more extreme in a sample of 566 males in Glasgow |population mean = 128.8 mmHg ) 125 126 127 128 129 130 131 x in R to find P value for the t value 2*pt(-1.99, df=566) = 0.047
Sampling summary • The SEM formula allows us to: • predict the accuracy of your estimate ( i.e. the mean value of our sample) • From our single sample • Assumes we have a Random sample
probability Aspects of the P value P Value sampling statistic Rule