Download
1 / 36
360 likes | 741 Views
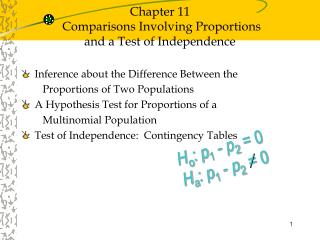
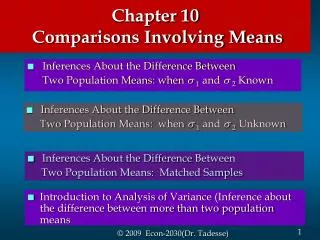
Chapter 10 Comparisons Involving Means Part A. Estimation of the Difference between the Means of Two Populations: Independent Samples Hypothesis Tests about the Difference between the Means of Two Populations: Independent Samples.

E N D
Chapter 10 Comparisons Involving MeansPart A • Estimation of the Difference between the Means of Two Populations: Independent Samples • Hypothesis Tests about the Difference between the Means of Two Populations: Independent Samples
Estimation of the Difference Between the Means of Two Populations: Independent Samples • Point Estimator of the Difference between the Means of Two Populations • Sampling Distribution of • Interval Estimate of Large-Sample Case • Interval Estimate of Small-Sample Case
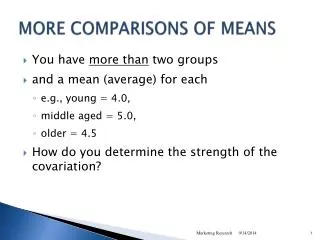
Let equal the mean of sample 1 and equal the mean of sample 2. • The point estimator of the difference between the • means of the populations 1 and 2 is . Point Estimator of the Difference Betweenthe Means of Two Populations • Let 1 equal the mean of population 1 and 2 equal the mean of population 2. • The difference between the two population means is 1 - 2. • To estimate 1 - 2, we will select a simple random sample of size n1 from population 1 and a simple random sample of size n2 from population 2.
Sampling Distribution of • Expected Value • Standard Deviation where:1 = standard deviation of population 1 2 = standard deviation of population 2 n1 = sample size from population 1 n2 = sample size from population 2
Interval Estimate of 1 - 2:Large-Sample Case (n1> 30 and n2> 30) • Interval Estimate with 1 and 2 Known where: 1 - is the confidence coefficient
Interval Estimate of 1 - 2:Large-Sample Case (n1> 30 and n2> 30) • Interval Estimate with 1 and 2 Unknown where:
Interval Estimate of 1 - 2:Large-Sample Case (n1> 30 and n2> 30) • Example: Par, Inc. Par, Inc. is a manufacturer of golf equipment and has developed a new golf ball that has been designed to provide “extra distance.” In a test of driving distance using a mechanical driving device, a sample of Par golf balls was compared with a sample of golf balls made by Rap, Ltd., a competitor. The sample statistics appear on the next slide.
Interval Estimate of 1 - 2:Large-Sample Case (n1> 30 and n2> 30) • Example: Par, Inc. Sample #1 Par, Inc. Sample #2 Rap, Ltd. Sample Size 120 balls 80 balls Sample Mean 235 yards 218 yards Sample Std. Dev. 15 yards 20 yards
Simple random sample of n1 Par golf balls x1 = sample mean distance for sample of Par golf ball Simple random sample of n2 Rap golf balls x2 = sample mean distance for sample of Rap golf ball x1 - x2 = Point Estimate of m1 –m2 Point Estimator of the Difference Betweenthe Means of Two Populations Population 1 Par, Inc. Golf Balls m1 = mean driving distance of Par golf balls Population 2 Rap, Ltd. Golf Balls m2 = mean driving distance of Rap golf balls m1 –m2= difference between the mean distances
Point Estimate of the DifferenceBetween Two Population Means Point estimate of 1-2 = = 235 - 218 = 17 yards where: 1 = mean distance for the population of Par, Inc. golf balls 2 = mean distance for the population of Rap, Ltd. golf balls
95% Confidence Interval Estimate of the Difference Between Two Population Means: Large-Sample Case, 1 and 2 Unknown Substituting the sample standard deviations for the population standard deviation: 17 + 5.14 or 11.86 yards to 22.14 yards We are 95% confident that the difference between the mean driving distances of Par, Inc. balls and Rap, Ltd. balls is 11.86 to 22.14 yards.
Using Excel to Develop anInterval Estimate of m1 – m2: Large-Sample Case • Formula Worksheet Note: Rows 16-121 are not shown.
Using Excel to Develop anInterval Estimate of m1 – m2: Large-Sample Case • Value Worksheet Note: Rows 16-121 are not shown.
Interval Estimate with Interval Estimate of 1 - 2:Small-Sample Case (n1 < 30 and/or n2 < 30) where:
Interval Estimate of 1 - 2:Small-Sample Case (n1 < 30 and/or n2 < 30) • Interval Estimate with 2 Unknown where:
Difference Between Two Population Means: Small Sample Case • Example: Specific Motors • Specific Motors of Detroit has developed a new automobile known as the M car. 12 M cars and 8 J cars (from Japan) were road tested to compare miles-per-gallon (mpg) performance. The sample statistics are shown on the next slide.
Difference Between Two Population Means: Small Sample Case • Example: Specific Motors Sample #1 M Cars Sample #2 J Cars 12 cars 8 cars Sample Size 29.8 mpg 27.3 mpg Sample Mean 2.56 mpg 1.81 mpg Sample Std. Dev.
Point Estimate of the DifferenceBetween Two Population Means Point estimate of 1-2 = = 29.8 - 27.3 = 2.5 mpg where: 1 = mean miles-per-gallon for the population of M cars 2 = mean miles-per-gallon for the population of J cars
95% Confidence Interval Estimate of the Difference Between Two Population Means: Small-Sample Case We will make the following assumptions: • The miles per gallon rating is normally • distributed for both the M car and the J car. • The variance in the miles per gallon rating • is the same for both the M car and the J car.
95% Confidence Interval Estimate of the Difference Between Two Population Means: Small-Sample Case • We will use a weighted average of the two sample • variances as the pooled estimator of 2.
95% Confidence Interval Estimate of the Difference Between Two Population Means: Small-Sample Case 2.5 + 2.2 or .3 to 4.7 miles per gallon • Using the t distribution with n1 + n2 - 2 = 18 degrees • of freedom, the appropriate t value is t.025 = 2.101. We are 95% confident that the difference between the mean mpg ratings of the two car types is .3 to 4.7 mpg (with the M car having the higher mpg).
Using Excel to Develop anInterval Estimate of m1 – m2: Small-Sample • Formula Worksheet
Using Excel to Develop anInterval Estimate of m1 – m2: Small-Sample • Value Worksheet
Hypotheses Test Statistic Hypothesis Tests About the Difference between the Means of Two Populations: Independent Samples Large-Sample Small-Sample
Hypothesis Tests About the Difference Between the Means of Two Populations: Independent Samples, Large-Sample Case • Example: Par, Inc. Recall that Par, Inc. has developed a new golf ball that was designed to provide “extra distance.” A sample of Par golf balls was compared with a sample of golf balls made by Rap, Ltd., a competitor. The sample statistics appear on the next slide.
Hypothesis Tests About the Difference Between the Means of Two Populations: Independent Samples, Large-Sample Case • Example: Par, Inc. Can we conclude, using a = .01, that the mean driving distance of Par, Inc. golf balls is greater than the mean driving distance of Rap, Ltd. golf balls? Sample #1 Par, Inc. Sample #2 Rap, Ltd. Sample Size 120 balls 80 balls Sample Mean 235 yards 218 yards Sample Std. Dev. 15 yards 20 yards
Hypothesis Tests About the Difference Between the Means of Two Populations: Independent Samples, Large-Sample Case • Using the Test Statistic 1. Determine the hypotheses. H0: 1 - 2< 0 Ha: 1 - 2 > 0 where: 1 = mean distance for the population of Par, Inc. golf balls 2 = mean distance for the population of Rap, Ltd. golf balls
Hypothesis Tests About the Difference Between the Means of Two Populations: Independent Samples, Large-Sample Case • Using the Test Statistic a = .01 2. Specify the level of significance. 3. Select the test statistic. 4. State the rejection rule. Reject H0 if z > 2.33
Hypothesis Tests About the Difference Between the Means of Two Populations: Independent Samples, Large-Sample Case • Using the Test Statistic 5. Compute the value of the test statistic.
Hypothesis Tests About the Difference Between the Means of Two Populations: Independent Samples, Large-Sample Case • Using the Test Statistic 6. Determine whether to reject H0. z = 6.49 > z.01 = 2.33, so we reject H0. At the .01 level of significance, the sample evidence indicates the mean driving distance of Par, Inc. golf balls is greater than the mean driving distance of Rap, Ltd. golf balls.
… continued Using Excel to Conduct aHypothesis Test about m1 – m2: Large Sample Case • Excel’s “z-Test: Two Sample for Means” Tool Step 1Select the Tools menu Step 2Choose the Data Analysis option Step 3 Choose z-Test: Two Sample for Means from the list of Analysis Tools
… continued Using Excel to Conduct aHypothesis Test about m1 – m2: Large Sample Case • Excel’s “z-Test: Two Sample for Means” Tool Step 4When the z-Test: Two Sample for Means dialog box appears: Enter A1:A121 in the Variable 1 Range box Enter B1:B81 in the Variable 2 Range box Type 0 in the Hypothesized Mean Difference box Type 225 in the Variable 1 Variance (known) box Type 400 in the Variable 2 Variance (known) box
Using Excel to Conduct aHypothesis Test about m1 – m2: Large Sample Case • Excel’s “z-Test: Two Sample for Means” Tool Step 4 (continued) Select Labels Type .01 in the Alpha box Select Output Range Enter D4 in the Output Range box (Any upper left-hand corner cell indicating where the output is to begin may be entered) Click OK
Using Excel to Conduct aHypothesis Test about m1 – m2: Large Sample Case
Using Excel to Conduct aHypothesis Test about m1 – m2: Large Sample Case • Value Worksheet Note: Rows 16-121 are not shown.
Using Excel to Conduct aHypothesis Test about m1 – m2: Large Sample Case • Using the p -Value 4. Compute the value of the test statistic. The Excel worksheet states z = 6.48 5. Compute the p–value. The Excel worksheet states p-value = 4.501E-11 6. Determine whether to reject H0. Because p–value < a = .01, we reject H0.