Download

1 / 27
270 likes | 407 Views
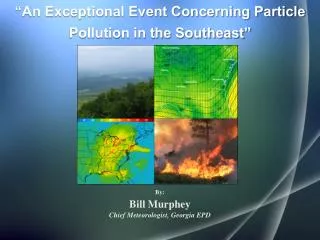
Exploring a Pollution Event . Glenn Gehring, Technology Specialist III Tribal Air Monitoring Support (TAMS) Center Institute for Tribal Environmental Professionals (ITEP) Northern Arizona University 541-612-0899 glenn.gehring@nau.edu http://www4.nau.edu/itep http://www4.nau.edu/tams.

E N D
Exploring a Pollution Event Glenn Gehring, Technology Specialist III Tribal Air Monitoring Support (TAMS) Center Institute for Tribal Environmental Professionals (ITEP) Northern Arizona University541-612-0899 glenn.gehring@nau.edu http://www4.nau.edu/itep http://www4.nau.edu/tams
What Do These Data Mean? Vertical manifold Tubing for NOy Gas Analyzer Rack Toxics Flow Controller 316 Stainless Steel 1/8 inch tubing connects regulator to calibrator NOy Data Logger Continuous Particulate Sensor Unit NOx Calibrator SO2 Continuous Particulate Monitor Control Units Ozone CGA 660? Fitting must match bottle Zero Air Generator EPA Protocol Gas
Two big factors related to pollutant dispersion: Ventilation Index (horizontal movement) Stability (vertical mixing)
Mixing Height & Wind = Ventilation Index Mixing Height Wind
NOAA ARL Stability Forecast Zi - Boundary layer depth (meters above model terrain) 10xKz - Vertical mixing coefficient times 10 (m2/s2) A – Extremely Unstable B – Moderately Unstable C – Slightly Unstable D – Neutral E – Slightly Stable F – Moderately Stable G – Extremely Stable Includes an indication of upward push
Ozone and PM-2.5 Readily Transport long distances and React in the Atmosphere Ozone is the Product of a Reaction Initiated by Light (Photochemical Reaction) in the Atmosphere; Ozone “Precursors,” such as NOx and VOCs are Emitted From Sources
Quapaw Site on July 22, 2004 – Site’s highest 8-hr Ozone 93 ppb as an 8-hour average
What were other 8-Hour ozone concentrations on July 22, 2004?
I selected ozone for one state at a time and merged the resulting data in a spreadsheet.
Since these data have spatial references for each monitoring site (lat, long) I can easily put this data into GIS software. Then I can use gradients to make higher concentrations appear as larger circles on the map.
Area 8-hr Ozone on July 22, 2004 Saint Louis Kansas City Quapaw Site Oklahoma City Tulsa Memphis Little Rock
I can also use GIS extensions to help illustrate. 8-hr Ozone on July 22, 2004 with Prediction Contours (ESRI Geostatistical Analyst) Quapaw Site
I can use Air Data or other resources to get point source emissions data, map it and make the size of the circles proportional to emissions. I can also use NOAA’s Air Resources Laboratory’s HYSPLIT software to perform backward trajectories from monitoring sites on the day of concern.
July 22, 2004, 24-hour Backward Trajectories (NOAA Air Resource Laboratory HYSPLIT Model) proportional NOx point source emissions – 2002 EI Quapaw Site
Now I have some suspect areas that may have contributed to the problem (something near the three coal-fired power plants). I can use ARL’s HYSPLIT software to run forward dispersions from the power plants to see where the model indicates their emissions were when I had the high concentration. In this example I set the model to average concentrations from 100 m to ground level and set it for a 48-hour release beginning 48-hours prior to the high concentration at the Quapaw site.
Oologah Power Plant 48-hr dispersion (NOAA Air Resource Laboratory HYSPLIT Model) Quapaw Site
GRDA Power Plant 48-hr dispersion (NOAA Air Resource Laboratory HYSPLIT Model) Quapaw Site
Muskogee Power Plant 48-hr dispersion (NOAA Air Resource Laboratory HYSPLIT Model) Quapaw Site
Combined 48-hr dispersion (NOAA Air Resource Laboratory HYSPLIT Model) Quapaw Site
Forward Trajectory from 3 Coal-Fired Power Plants on July 22, 2004 (endpoints that are less than 10 meters AGL)
Forward Trajectory from 3 Coal-Fired Power Plants on July 22, 2004 (endpoints that are less than 20 meters AGL)
NE Oklahoma Coal-Fired Power Plant NOx EmissionsSource: EPA AirData (1999 EI) Most Relevant Winds for Ozone Tulsa Ozone Season Wind Rose, Lines Indicate the Direction the Wind Came FROM, and Colors Indicate Wind Speed (1984-1992, March 1 to October 31, from 8 AM to 6 PM) What if you live here? N E W 2003 Ozone Monitoring Locations (Red Dots) S 26.5% of Oklahoma facility NOx emissions are from Muskogee, Mayes and Rogers Counties (1999) 22.9% of Oklahoma facility NOx emissions are from three NE Oklahoma coal-fired power plants (1999)