Download
1 / 70
720 likes | 892 Views
Pollution. IB syllabus: 5.1.1-5.1.3, 5.2.1-5.2.3, 5.3.1-5.3.3 Ch 19 Video – Strange Days on Planet Earth 2 – dirty secrets Labs colliform testing Waterway’s health in a bag. Syllabus statements. 5.1.1: Define the term pollution

E N D
Pollution IB syllabus: 5.1.1-5.1.3, 5.2.1-5.2.3, 5.3.1-5.3.3 Ch 19 Video – Strange Days on Planet Earth 2 – dirty secrets Labs colliform testing Waterway’s health in a bag
Syllabus statements • 5.1.1: Define the term pollution • 5.1.2: Distinguish the terms point source pollution and non-point source pollution and outline the challenges they present for management • 5.2.3: State the major sources of pollutants
Story of Cap and Trade • http://www.storyofstuff.com/capandtrade/
Syllabus statements • 5.2.1: Describe two direct methods of monitoring pollution • 5.2.2: Define the term biological oxygen demand (BOD) and explain how this indirect method is used to assess pollution levels in water • 5.2.3: Describe and explain an indirect method of measuring pollution levels using a biotic index
Syllabus statements • 5.3.1: Outline approaches to pollution management with respect to figure 5 • 5.3.2: Discuss the human factors that affect the approaches to pollution management • 5.3.3: Evaluate the costs and benefits to society of the World Health Organization’s ban on the use of the pesticide DDT
Vocabulary • Pollution • Point source pollution • Non point source pollution
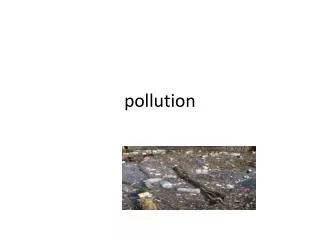
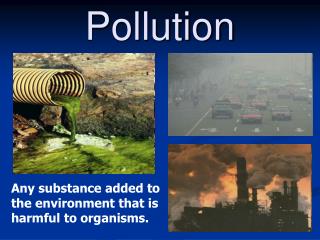
Pollution is • The addition to an environment of a substance or an agent (such as heat) by human activity faster than it can be rendered harmless by the environment and which has an appreciable effect on organisms within it
Pollution comes from • Combustion of fossil fuels carbon, sulfur, & nitrogen oxides; particulates; heavy metals • Domestic and industrial waste garbage; sewage, materials, toxic waste • Manufacturing others above plus chemicals and toxins; packaging; shipping • Agricultural systems pesticides; animal and plant wastes; fertilizers; others above
Pollution goes to • The air but we need clean air to breathe to survive • The water but we need fresh water to drink, and depend on aquatic species for food • The land but we grow our food on the land and live on it
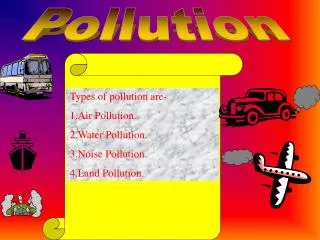
Types of Pollution Sources • Point Sources • Discharge pollutants at specific locations • Factories, sewage treatment plants, mines • Non point sources • Cannot be traced to a single point of discharge • Acid deposition, surface runoff • Agricultural forms – sediment, fertilizer, manure • 64% total pollutants entering in US
NONPOINT SOURCES Rural homes Cropland Urban streets Animal feedlot POINT SOURCES Suburban development Factory Wastewater treatment plant Point vs. Nonpoint
Which is easier to control? • Point sources are easier to manage because effects are localized • Allows emission control • Allows determination of responsibility and taking legal action
We need to monitor this pollution • Various techniques are used to measure this pollution in its different locations
Monitoring water Quality • Sampling coliform bacteria colonies 0 / 100 ml for drinking, 200 / 100 ml swimming • BOD measurements of decomposer content • Chemical analyses – test for pollutants (Pb, Hg, etc.) or nitrates, nitrites, ammonium • Indicator species – amphibians, trout, aquatic birds
Water monitoring – Coliform testing • Coliform bacteria from feces – maybe from natural animals but also input from sewage • Take water samples at desired locations (here taken along the beach) • Plate out a know volume of water on a nutrient medium (some media allow staining of colonies) • Incubate overnight then count number of colonies observed
BOD measurements • BOD = Biological oxygen demand A measure of the amount of dissolved oxygen required to break down organic matter in a given volume of water through aerobic biological activity • Indirect means of measuring pollution levels in the environment • Usually measured in context of sewage pollution
BOD • Sewage carried with it disease organisms, detergents & nutrients • Causes enrichment (excess nutrients we’ll deal with this in eutrophication section) and oxygen demand • Degraded through decomposition by microorganisms through process of cell respiration into H2O, CO2 • Requires oxygen which is also used by other aquatic organisms
BOD • Oxygen has limited ability to dissolve into water • With excess organics little oxygen left for organisms • In extreme situations all fish die • May lead to dead zone formation
Mississippi River Basin Ohio River Missouri River Mississippi River LOUISIANA Mississippi River Depleted Oxygen Gulf of Mexico
Water Quality DO (ppm) at 20˚C Good 8-9 Slightly polluted 6.7-8 Moderately polluted 4.5-6.7 Heavily polluted Below 4.5 Gravely polluted Below 4 Dissolved oxygen is an indicator of the quality of water in an area
Sewage and other organic wastes are measured in terms of their BOD • This is amount of oxygen microorganisms need to decompose wastes • Usually expressed in mg/L • When there is a high BOD, the DO is low • Microorganisms also produce copounds with unpleasant odors
Clean Zone Decomposition Zone Septic Zone Recovery Zone Clean Zone Normal clean water organisms (trout, perch, bass, mayfly, stonefly) Trash fish (carp, gar, leeches) Fish absent, fungi, sludge worms, bacteria (anaerobic) Trash fish (carp, gar, leeches) Normal clean water organisms (trout, perch, bass, mayfly, stonefly) Types of organisms 8 ppm 8 ppm Dissolved oxygen Oxygen sag Concentration Biological oxygen demand 2 ppm Direction of flow Point of waste or heat discharge Time or distance downstream
Great Lakes Case Study • 20% of world fresh surface water • 14% US population lives here • Suffering from – eutrophication, fish kills, bacterial contamination, toxic waste • $20 billion pollution control program now in place • Drop in many of pollutants but long way to go
CANADA Nipigon Bay Jackfish Bay Thunder Bay Silver Bay St. Mary’s R. St. Lawrence R. Spanish R. St. Louis R. MICHIGAN Penetary Bay Sturgeon Bay WISCONSIN MICHIGAN Saginaw Bay NEW YORK Niagara Falls Saginaw R. System Grand R. MINNESOTA Niagara R. St. Clair R. Thames R. Buffalo R. Detroit R. Rouge R. Raisin R. Ashtabula R. PENNSYLVANIA IOWA Cuyahoga R. Maumee R. Rocky R. Black R. ILLINOIS INDIANA OHIO Great Lakes drainage basin Most polluted areas, according to the Great Lakes Water Quality Board “Hot spots” of toxic concentrations in water and sediments Eutrophic areas
Lake Erie: 1969 Industrial pollution Suffocated fish Beaches closed Sewage runoff Dead algae Low dissolved oxygen Decreased fish population Mercury- tainted fish
Suburban sprawl Lower water levels Clear water High dissolved oxygen Thriving fish population PCBs in sediment Lake Erie: Today
Laws and reforms • U.S. Clean Water Act: 1972 and amended in 1977 • Improved overall quality but still work to be done • 2002 “Discharge trading policy” – polluters can go beyond quota by borrowing from others • Is our water policy too restrictive? • Should it be even stricter?
Secondary Primary Grit chamber Chlorine disinfection tank Bar screen Settling tank Aeration tank Settling tank To river, lake, or ocean Raw sewage from sewers (kills bacteria) Sludge Activated sludge Air pump Sludge digester Sludge drying bed Disposed of in landfill or ocean or applied to cropland, pasture, or rangeland
Sewage Treatment • 97% suspended solids removed • 95% oxygen demanding wastes removed • 70% toxic metals removed • 70% phosphorous, 50% nitrates removed • 5% dissolved salts • Only a fraction of pesticides, radioactive substances, etc. • Most cities not fully effective in water treatment processes
(1)Raw sewage drains by gravity into the first pool and flows through a long perforated PVC pipe into a bed of limestone gravel. (3) Wastewater flows through another perforated pipe into a second pool, where the same process is repeated. Sewage Treated water Wetland type plants Wetland type plants 45 centimeter layer of limestone gravel coated with decomposing bacteria First concrete pool Second concrete pool (2) Microbes in the limestone gravel break down the sewage into chemicals that can be absorbed by the plant roots, and the gravel absorbs phosphorus. (4) Treated water flowing from the second pool is nearly free of bacteria and plant nutrients. Treated water can be recycled for irrigation and flushing toilets. A Natural Method of wastewater Treatment: Wastewater Gardens
Air pollution • Presence of one or more chemicals in the atmosphere in amount to cause • Harm to life forms & materials • Alteration of climate • 6 major classes of pollutants • Some natural sources, mostly man made (anthropogenic) • Stationary vs Mobile sources • Primary pollutants = Emitted directly into troposphere in a harmful form • Secondary pollutants = reaction of primary pollutants with each other & basic air components
2 – SO4 NO3 – Primary Pollutants CO CO2 Secondary Pollutants SO2 NO NO2 SO3 Most hydrocarbons HNO3 H2SO4 Most suspended particles H2O2 O3 PANs Most and salts Natural Sources Stationary Mobile
Distribution of Air pollutants • Mostly concentrated in urban areas • Prevailing winds distribute them to down wind areas • Even around the earth • Government mandated standards for 6 criteria air pollutants (Table 17-2) • CO: carbon monoxide, NO2: nitrogen oxide, SO2:sulfur dioxide, O3: ozone, Pb: lead, SPM: suspended particulate matter
Monitoring Air Pollution • Monitoring ozone, sulfur and nitrogen oxides, carbon monoxide, particulates • Capture known volume • Measure amount of target chemical with Gaseous sampling probes, spectrometers, etc. • Set sampling points – monitor over time • Observe changes taking place
Can be measured indirectly as well • Recall indicator species – like amphibians, songbirds, trout, - are those whose health indicates the health of the environment • Part of this depends on the range of tolerance for the target species as well
Indirect Measurement • We can use other aspects of populations and communities as rough indices too • Biomonitoring – who’s there • Abundance – How many of each organism • Biodiversity calculations work well • Simpson’s Index in two areas – polluted and unpolluted
Pollution sensitive organisms – presence indicates healthy habitat
Moderately Pollution tolerant organisms – presence indicates some habitat concerns
Pollution tolerant organisms – presence indicates habitat concerns
Or just calculate biodiversity • Sample upstream and down stream from point source pollution • Identify organisms and count numbers of each • Use diversity equation –get a relative diversity & lower D more polluted
Pollution Management • Human pollutants produce long term and far reaching effects • Strategies for reducing impacts can be directed at three different levels in the process • Altering the human activity • Reducing the quantity of pollutant released at the point of emission • Cleaning up the pollutant and restoring the ecosystem after pollution occurs
Of course the earlier action is taken the better – stopping the emissions altogether would be best • Remember the need for collaboration in the management of pollution • National, state and local policy working in concert