Download
1 / 7
70 likes | 78 Views
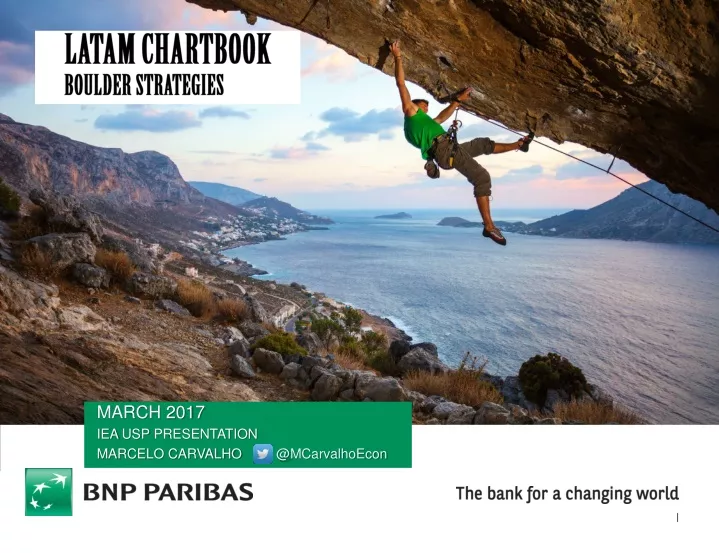
Latam Chartbook BOULDER STRATEGIES. MARCH 2017 Iea usp presentation Marcelo Carvalho @ MCarvalhoEcon. GLOBAL MONETARY POLICY. Fed Funds target rate and 2yr Treasury bond yields (%, a.r.). Source: ECB, FED, BoJ, Macrobond, BNP Paribas. Global monetary policy: still easy.

E N D
LatamChartbook BOULDER STRATEGIES MARCH 2017 Ieausp presentation Marcelo Carvalho @MCarvalhoEcon
GLOBAL MONETARY POLICY • Fed Funds target rate and 2yr Treasury bond yields (%, a.r.) • Source: ECB, FED, BoJ, Macrobond, BNP Paribas • Global monetary policy: still easy
GLOBAL: COMMODITY PRICES • IMF non-fuel commodities price index (2005=100) • Source: IMF, Macrobond, BNP Paribas. Dotted lines show IMF forecasts. • Looking better
LATAM: COMMODITIES AS A SHARE OF LATAM EXPORTS (%) • Source: IBGE, DANE, INEGI, BCRA, INE. Ratios based on 2013 data. • Export exposure to commodities varies across the region
LATAM: REAL GDP GROWTH PERFORMANCE (%, y/y) • Source: IMF, BNP Paribas; *BNP Paribas Market Economics forecasts • Growth is down from the golden days of the commodity price boom, but should recover
LATAM: DOING BUSINESS RANKING CORRELATES WITH INCOME • BIGGER NUMBERS MEAN WORSE AT DOING BUSINESS RANK • Source: World Bank, BNP Paribas; • The good: Chile, Mexico, Peru, Colombia. The bad: Brazil, Argentina. The ugly: Venezuela.
LATAM: QUALITY OF EDUCATION AND INFRASTRUCTURE • HIGHER MEANS BETTER *Students’ outcomes on mathematics test in the latest Programme for International Assessment (Pisa). The scales reflect the percentile ranking. • Source: OECD, World Economic Forum, BNP Paribas. • Latam countries need to improve their human capital and physical infrastructure