Download
1 / 89
890 likes | 900 Views
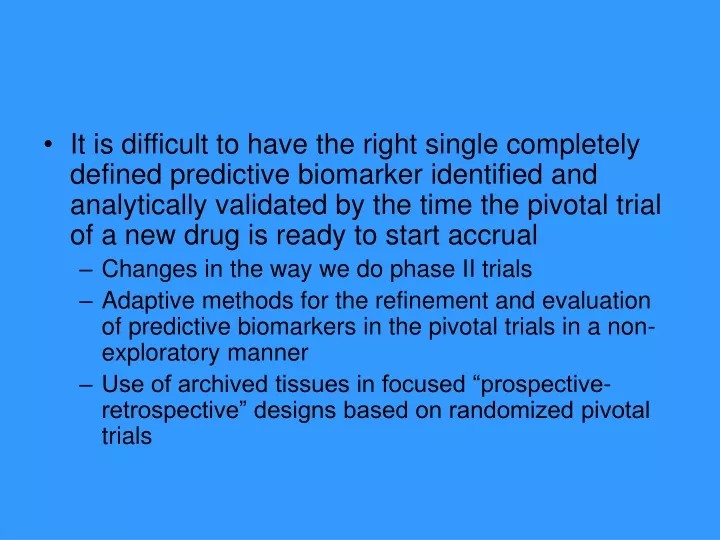
It is difficult to have the right single completely defined predictive biomarker identified and analytically validated by the time the pivotal trial of a new drug is ready to start accrual Changes in the way we do phase II trials

E N D
It is difficult to have the right single completely defined predictive biomarker identified and analytically validated by the time the pivotal trial of a new drug is ready to start accrual • Changes in the way we do phase II trials • Adaptive methods for the refinement and evaluation of predictive biomarkers in the pivotal trials in a non-exploratory manner • Use of archived tissues in focused “prospective-retrospective” designs based on randomized pivotal trials
Biomarker Adaptive Threshold Design Wenyu Jiang, Boris Freidlin & Richard Simon JNCI 99:1036-43, 2007
Biomarker Adaptive Threshold Design • Randomized trial of T vs C • Have identified a univariate biomarker index B thought to be predictive of patients likely to benefit from T relative to C • Eligibility not restricted by biomarker • No threshold for biomarker determined • Biomarker value scaled to range (0,1) • Time-to-event data
Procedure AFallback Procedure • Compare T vs C for all patients • If results are significant at level .04 claim broad effectiveness of T • Otherwise proceed as follows
Procedure A • Test T vs C restricted to patients with biomarker B > b • Let S(b) be log likelihood ratio statistic • Repeat for all values of b • Let S* = max{S(b)} • Compute null distribution of S* by permuting treatment labels • If the data value of S* is significant at 0.01 level, then claim effectiveness of T for a patient subset • Compute point and interval estimates of the threshold b
Sample Size Planning (A) • Standard broad eligibility trial is sized for 80% power to detect reduction in hazard D at significance level 5% • Biomarker adaptive threshold design is sized for 80% power to detect same reduction in hazard D at significance level 4% for overall analysis
Estimated Power of Broad Eligibility Design (n=386 events) vs Adaptive Design A (n=412 events) 80% power for 30% hazard reduction
506 prostate cancer patients were randomly allocated to one of four arms: Placebo and 0.2 mg of diethylstilbestrol (DES) were combined as control arm C 1.0 mg DES, or 5.0 mg DES were combined as E. The end-point was overall survival (death from any cause). Covariates: Age: In years Performance status (pf): Not bed-ridden at all vs other Tumor size (sz): Size of the primary tumor (cm2) Index of a combination of tumor stage and histologic grade (sg) Serum phosphatic acid phosphatase levels (ap)
Procedure B • S(b)=log likelihood ratio statistic for treatment effect in subset of patients with Bb • T=max{S(0)+R, max{S(b)}} • Compute null distribution of T by permuting treatment labels • If the data value of T is significant at 0.05 level, then reject null hypothesis that T is ineffective • Compute point and interval estimates of the threshold b
Sample Size Planning (B) • Estimate power of procedure B relative to standard broad eligibility trial based on Table 1 for the row corresponding to the expected proportion of sensitive patients ( ) and the target hazard ratio for sensitive patients • e.g. =25% and =.4 gives RE=.429/.641=.67 • When B has power 80%, overall test has power 80*.67=53% • Use formula B.2 to determine the approximate number of events needed for overall test to have power 53% for detecting =.4 limited to =25% of patients
Example Sample Size Planning for Procedure B • Design a trial to detect =0.4 (60% reduction) limited to =25% of patients • Relative efficiency from Table 1 .429/.641=.67 • When procedure B has power 80%, standard test has power 80%*.67=53% • Formula B.2 gives D’=230 events to have 53% power for overall test and thus approximate 80% power for B • Overall test needs D=472 events for 80% power for detecting the diluted treatment effect
Events needed to Detect Hazard Ratio With Proportional Hazards
Events (D’) Needed for Overall Test to Detect Hazard Ratio Limited to Fraction
Multiple Biomarker DesignA Generalization of the Biomarker Adaptive Threshold Design • Have identified K candidate binary classifiers B1 , …, BK thought to be predictive of patients likely to benefit from T relative to C • RCT comparing new treatment T to control C • Eligibility not restricted by candidate classifiers • Let the B0 classifier classify all patients positive
Test T vs C restricted to patients positive for Bk for k=0,1,…,K • Let S(Bk) be a measure of treatment effect in patients positive for Bk • Let S* = max{S(Bk)} , k* = argmax{S(Bk)} • S* is the largest treatment effect observed • k* is the marker that identifies the patients where the largest treatment effect is observed
For a global test of significance • Randomly permute the treatment labels and repeat the process of computing S* for the shuffled data • Repeat this to generate the distribution of S* under the null hypothesis that there is no treatment effect for any subset of patients • The statistical significance level is the area in the tail of the null distribution beyond the value of S* obtained for the un-suffled data • If the data value of S* is significant at 0.05 level, then claim effectiveness of T for patients positive for marker k*
Repeating the analysis for bootstrap samples of cases provides • an estimate of the stability of k* (the indication)
Adaptive Signature Design An adaptive design for generating and prospectively testing a gene expression signature for sensitive patients Boris Freidlin and Richard Simon Clinical Cancer Research 11:7872-8, 2005
Adaptive Signature DesignEnd of Trial Analysis • Compare E to C for all patients at significance level 0.04 • If overall H0 is rejected, then claim effectiveness of E for eligible patients • Otherwise
Otherwise: • Using only the first half of patients accrued during the trial, develop a binary classifier that predicts the subset of patients most likely to benefit from the new treatment E compared to control C • Compare E to C for patients accrued in second stage who are predicted responsive to E based on classifier • Perform test at significance level 0.01 • If H0 is rejected, claim effectiveness of E for subset defined by classifier
Treatment effect restricted to subset.10% of patients sensitive, 10 sensitivity genes, 10,000 genes, 400 patients.
Overall treatment effect, no subset effect.10% of patients sensitive, 10 sensitivity genes, 10,000 genes, 400 patients.
Classifier Development • Using data from stage 1 patients, fit all single gene logistic models (j=1,…,M) • Select genes with interaction significant at level
Classification of Stage 2 Patients • For i’th stage 2 patient, selected gene j votes to classify patient as preferentially sensitive to T if
Classification of Stage 2 Patients • Classify i’th stage 2 patient as differentially sensitive to T relative to C if at least G selected genes vote for differential sensitivity of that patient
Adaptive Signature Design for Clinical Trial of Advanced Prostate Cancer Richard Simon, D.Sc. Chief, Biometric Research Branch, National Cancer Institute http://brb.nci.nih.gov
Cancers of a primary site often represent a heterogeneous group of diverse molecular diseases which vary fundamentally with regard to the oncogenic mutations that cause them their responsiveness to specific drugs
How can we develop new drugs in a manner more consistent with modern tumor biology and obtain reliable information about what regimens work for what kinds of patients?
Developing a drug with a companion test increases complexity and cost of development but should improve chance of success and has substantial benefits for patients and for the economics of medical care
Although the randomized clinical trial remains of fundamental importance for predictive genomic medicine, some of the conventional wisdom of how to design and analyze rct’s requires re-examination The concept of doing an rct of thousands of patients to answer a single question about average treatment effect for a target population presumed homogeneous with regard to the direction of treatment efficacy in many cases no longer has an adequate scientific basis
Predictive biomarkers Measured before treatment to identify who will benefit from a particular treatment
Prospective Co-Development of Drugs and Companion Diagnostics in Ideal Settings Develop a completely specified classifier identifying the patients most likely to benefit from a new drug Based on biology, pre-clinical data and phase I-II studies Establish analytical validity of the classifier Design and analyze a focused clinical trial to evaluate effectiveness of the new treatment and how it relates to the classifier
Cancer biology is complex and it is not always possible to have the right single completely defined predictive classifier identified and analytically validated by the time the pivotal trial of a new drug is ready to start accrual Adaptive methods for the refinement and evaluation of predictive biomarkers in the pivotal trials in a non-exploratory manner Use of archived tissues in focused “prospective-retrospective” designs based on previously conducted randomized pivotal trials Simon, Paik, Hayes; JNCI 101:1-7, 2009
Adaptive Signature Design Boris Freidlin and Richard Simon Clinical Cancer Research 11:7872-8, 2005
Adaptive Signature DesignEnd of Trial Analysis Compare X to C for all patients at significance level 0.01 If overall H0 is rejected, then claim effectiveness of X for eligible patients Otherwise Compare X to C in adaptively defined subset of patients using threshold of statistical significance 0.04
Divide the patients randomly into a training set T and a validation set V. The training set will contain one-third of the patients. Using the biomarker information, treatment and outcome for the patients in T, develop a binary classifier that identifies the subset of patients who appear most likely to benefit from the new treatment X compared to control C f(B1,B2,B3,B4) = log hazard ratio of death for X relative to C as a function of biomarker values If f(B1,B2,B3,B4)/ser <c then Classifier(B1,B2,B3,B4)=X If f(B1,B2,B3,B4)/ser >c then Classifier(B1,B2,B3,B4)=C Cutpoint c optimized
Use the classifier developed in training set T to classify the patients in the validation set V. Let VX denote the subset of patients in V who are classified as likely to benefit from X Compare survivals of patients who received T to survivals of those who received C for patients accrued in VX If the difference in survival is significant at level 0.04, then the new treatment is more effective than the control for patients with biomarker values for which Classifier(B1,B2,B3,B4) =X.
This approach can also be used to identify the subset of patients who don’t benefit from X in cases where X is superior to C overall at the 0.01 level. The patients in VC= V – VX are predicted not to benefit from X. Survivals of X vs C can be examined for patients in that subset and a confidence interval for the hazard ratio calculated.
This design has improved statistical power for identifying treatments that benefit a subset of patients in molecularly heterogeneous diseases It has greater specificity than the standard approach which results in over-treatment of vast numbers of patients with approved drugs that do not benefit them
Sample Size Planning for Advanced Prostate Cancer Trial • Survival endpoint • Final analysis when there are 700 deaths total • 90% power for detecting a 25% overall reduction in hazard at two-sided 0.01 significance level (increase in median from 12 months to 9 months) • Power for evaluating treatment in adaptively determined subset • 157 deaths required for 80% power to detect 37% reduction in hazard at two-sided 0.04 significance level. • If one-third of patients in the validation set are classifier positive, then to have 157 deaths in the subset we need 157*3=471 deaths in the validation set. Since the validation set is two-thirds of the total, we require 707 total deaths. • To have 700 deaths at final analysis, 935 patients will be accrued and followed till the event rate is 75%