Download
1 / 26
260 likes | 365 Views
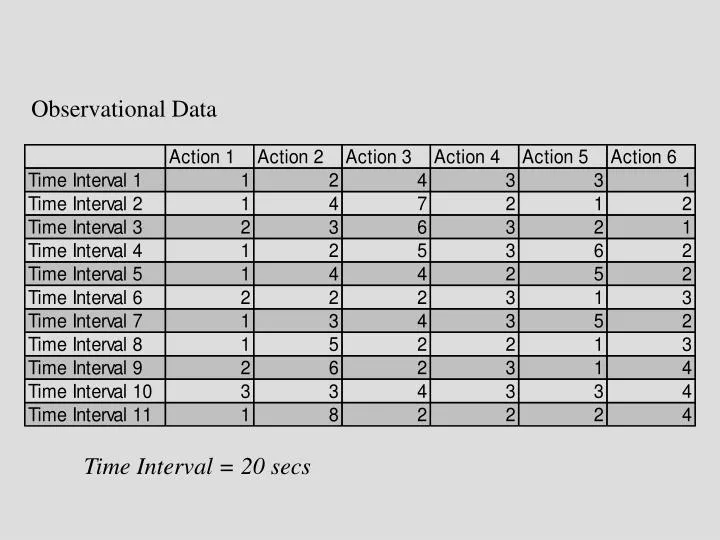
Observational Data. Time Interval = 20 secs. Factorial Analysis of Variance. What is a factorial design? Main effects Interactions Simple effects Magnitude of effect. Cont. What is a Factorial. At least two independent variables All combinations of each variable R X C factorial Cells.

E N D
Observational Data Time Interval = 20 secs
Factorial Analysis of Variance • What is a factorial design? • Main effects • Interactions • Simple effects • Magnitude of effect Cont.
What is a Factorial • At least two independent variables • All combinations of each variable • R X C factorial • Cells
Main effects If you have two factors in the experiment: Age and Instruction Condition. If you look at the effect of age, ignoring Instruction for the time being, you are looking at the main effect of age. If we look at the effect of instruction, ignoring age, then you are looking at the main effect of instruction.
Simple effects If you look at the effect of age at one level of instruction, then that is a simple effect. If you could restrict yourself to one level of one IV for the time being, and looking at the effect of the other IV within that level.
Magnitude of Effect F ratio is biased because it goes up with sample size. For a true estimate for the treatment effect size, use eta squared (the proportion of the treatment effect / total variance in the experiment). Eta Squared is a better estimate than F but it is still a biased estimate. A better index is Omega Squared.
Magnitude of Effect • Eta Squared • Interpretation • Omega squared • Less biased estimate k = number of levels for the effect in question
R2 is also often used. It is based on the sum of squares. For experiments use Omega Squared. For correlations use R squared. Value of R square is greater than omega squared. Cohen classified effects as Small Effect: .01 Medium Effect: .06 Large Effect: .15
Effects to be estimated • Differences due to instructions • Errors more in condition without instructions • Differences due to gender • Males appear higher than females • Interaction of video and gender • What is an interaction? • Do instructions effect males and females equally? Cont.
Estimated Effects--cont. • Error • average within-cell variance • Sum of squares and mean squares • Extension of the same concepts in the one-way
Calculations • Total sum of squares • Main effect sum of squares Cont.
Calculations--cont. • Interaction sum of squares • Calculate SScells and subtract SSV and SSG • SSerror = SStotal - SScells • or, MSerror can be found as average of cell variances
Degrees of Freedom • df for main effects = number of levels - 1 • df for interaction = product of dfmain effects • dferror = N - ab = N - # cells • dftotal = N - 1
Calculations for Data • SStotal requires raw data. • It is actually = 171.50 • SSvideo Cont.
Calculations--cont. • SSgender Cont.
Calculations--cont. • SScells • SSVXG = SScells - SSinstruction- SSgender= 171.375 - 105.125 - 66.125 = 0.125 Cont.
Calculations--cont. • MSerror = average of cell variances =(4.62 + 3.52 + 4.22 + 2.82)/4 =58.89/4 = 14.723 • Note that this is MSerror and not SSerror
Elaborate on Interactions • Diagrammed on next slide as line graph • Note parallelism of lines • Instruction differences did not depend on gender