Download
1 / 16
160 likes | 295 Views
Combining Institutional and U.S. Census Data to Set Benchmarks. 27 th Annual Conference Texas Association for Institutional Research February 22-25, 2005 Bruce Lockhart and Joe Meyer Texas State University San Marcos. Why benchmark with U.S. Census Bureau data?.

E N D
Combining Institutional and U.S. Census Data to Set Benchmarks 27th Annual Conference Texas Association for Institutional Research February 22-25, 2005 Bruce Lockhart and Joe Meyer Texas State University San Marcos
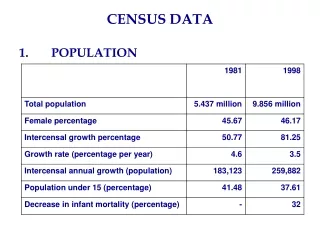
Why benchmark with U.S. Census Bureau data? • To evaluate how well your institution draws a diverse student population. • To set reasonable targets for where you want to be in future diversity. • To continually monitor progress from where you are today to where you want to be.
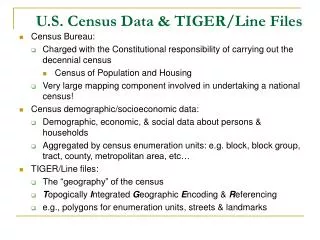
U.S. Census Bureau data that might be used in benchmarking • Population demographics and educational attainment data can be used to set targets for faculty and staff diversity. • Population demographics and growth trends can be used to target student recruitment.
Examples of employee diversity benchmarking at Texas State • Workforce diversity: • Targets may be dependent on geographic area of recruitment, educational attainment of the populace in recruitment area, and type of job being filled.
Employee and Recruitment Demographics Administrator and Faculty Diversity http://www.irp.txstate.edu/tair/attach12.xls Diversity indices at U.S. & Texas State http://www.irp.txstate.edu/tair/attach3.xls
Example of student recruitment targeting at Texas State • Student recruitment • Targets may be dependent on geographic location of institution, presence of competing institutions and feeder schools, and the diversity of potential students.
Texas State students and THECB Enrollment Projections Projections of Texas State growth by county, age, gender, and ethnicity: http://www.irp.txstate.edu/tair/projection.xls
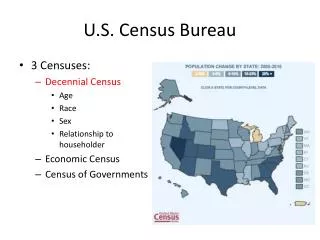
What kind of Census data are available? • Thematic maps for a big picture viewpoint. • Pre-formatted tabular data of most frequently requested information. • Build-your-own datasets by using Census Bureau tools.
Thematic Maps CensusScope at http://www.censusscope.org U.S. Census at http://factfinder.census.gov
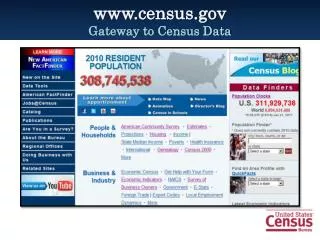
Preformatted Tables U.S. Census at http://www.census.gov Texas State Data Center at http://txsdc.utsa.edu
http://www.census.gov/ Census >ACS Home > Data Tables Main > Data Profiles 2003 > Texas From here you can highlight the table you want to use and copy it into an Excel worksheet http://factfinder.census.gov/home/en/acs_pums_2003.html Build-Your-Own Tables
Getting a look at the Data Want to download data to play with? This can be done in several formats including Access, SAS and CSV. http:www.census.gov/support/SF4ASCII.html The following will give you data profiles for Texas and metropolitan areas within the state. http://www.census.gov/acs/www/Products/Profiles/Single/2003/ACS/TX.htm
Data Web What is TheDataWeb? TheDataWeb brings together under one umbrella demographic, economic, environmental, health, (and more) datasets that are usually separated by geography and/or organization. TheDataWeb is the infrastructure for intelligent browsing and accessing data across the Internet. TheDataWeb provides access across the Internet to demographic, economic, environmental, health, and other databases housed in different systems in different agencies and organizations. TheDataWeb is a collection of systems and software that provide data query and extract capabilities, as well as data analysis and visualization tools, i.e., the DataFerrett. Why do you need TheDataWeb? You will need TheDataWeb if you want to integrate your own datasets or survey results or setup your organization's data. You will also need TheDataWeb if you/your organization wants to participate as a DataWeb Servlet system or Data node.
DataFerret What is the DataFerrett? DataFerrett is a unique data mining and extraction tool. DataFerrett allows you to select a databasket full of variables and then recode those variables as you need. You can then develop and customize tables. Selecting your results in your table you can create a chart or graph for a visual presentation into an html page. Save your data in the databasket and save your table for continued reuse. DataFerrett helps you locate and retrieve the data you need across the Internet to your desktop or system, regardless of where the data resides. DataFerrett: • lets you receive data in the form in which you need it (whether it be extracted to an ascii, SAS, SPSS, Excel/Access file); or • lets you move seamlessly between query, analysis, and visualization of data in one package; • lets data providers share their data easier, and manage their own online data.
Data Available Current DataSets Available through DataFerrett: Searchable Topics under DataFerrett American Community Survey (ACS)American Housing Survey (AHS)Behavioral Risk Factor Surveillance System (BRFSS)Consumer Expenditure Survey (CES)Current Population Survey (CPS)Decennial Census of Population and Housing (Census2000)National Ambulatory Medical Care Survey (NAMCS)National Center for Health Statistics Mortality-Underlying Cause-of-Death (MORT)National Health and Nutrition Examination Survey (HANES)National Health Interview Survey (NHIS)*National Hospital Ambulatory Medical Care Survey (NHAMCS)National Survey of Fishing, Hunting, and Wildlife-Assocated Recreation (FHWAR)Survey of Income and Program Participation (SIPP)Survey of Program Dynamics (SPD)
DataFerret tutorial DataFerrett User's Guide Part 1 - Getting StartedChapter 01 - History of the DataFerrettChapter 02 - DataFerrett at a GlanceChapter 03 - System RequirementsChapter 04 - Major Functions of DataFerrettPart 2 - MicrodataChapter 05 - Overview of Major FunctionsChapter 06 - Step 1: Select Survey & Variables TabChapter 07 - Browse Variables WindowChapter 08 - Step 2: The DataBasket TabChapter 09 - Recode WindowChapter 10 - Step 3: Download / Make a TableChapter 11 - Using the Geography WizardChapter 12 - Make a TableChapter 13 - Make A Graph Chapter 14 - Make A Map Chapter 15 - Microdata vs. Aggregate DataChapter 16 - Application vs. AppletSpecial Instructions for Extractions for SIPP Users Publishing Data to DataFerrett DataFerrett MIF Description TheDataWeb Publisher-Overview MetaData Information File Users' Guide