Download
1 / 120
1.21k likes | 1.39k Views
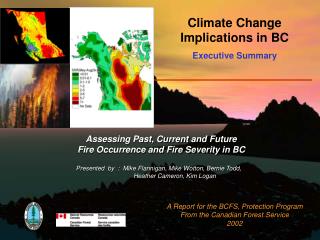
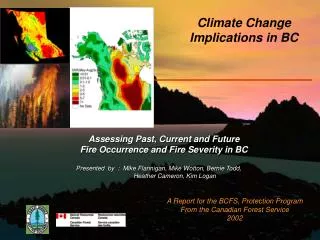
Climate Change Implications in BC. Assessing Past, Current and Future Fire Occurrence and Fire Severity in BC. Presented by : Mike Flannigan, Mike Wotton, Bernie Todd, Heather Cameron, Kim Logan. A Report for the BCFS, Protection Program From the Canadian Forest Service 2002.

E N D
Climate Change Implications in BC Assessing Past, Current and Future Fire Occurrence and Fire Severity in BC Presented by : Mike Flannigan, Mike Wotton, Bernie Todd, Heather Cameron, Kim Logan A Report for the BCFS, Protection Program From the Canadian Forest Service 2002
Collaborative Research Agreement between British Columbia Ministry of Forest, Protection Program NRCan - Canadian Forest Service Collaborators / Contacts BCFS – Judi Beck, John Flanagan CFS – Mike Flannigan, Brian Stocks, Mike Wotton, Bernie Todd, Heather Cameron, Kim Logan History Started July, 2000 The Project Mike Flannigan Mike Wotton Bernie Todd Heather Cameron Kim Logan Climate Change Implications in British Columbia Assessing Past, Current and FutureFire Occurrence and Fire Severity in British Columbia
Original Goals and Deliverables Background Climate Modeling Regional Climate Model (RCM) Sea Surface Temperature (SST) Future Climate Data RCM Projections for Western Canada RCM Projections for BC Validating RCM Projections – Historic vs RCM Creating Future Climate Projections Comparing the Amount of Change in Future Climate Projections Presentation Objectives
Historical Fire Occurrence and Weather Analysis Fire Occurrence Statistics by Biogeoclimatic (BEC) Zones Creating Historical Fire and Weather Data Defining Fire Danger Relationships by BEC Zones Fire Season Analysis Relationships between SST and Fire Seasons Seasonal Fire Occurrence Prediction Tool Presentation Objectives
Seasonal Drought Analysis Developing Anomaly Maps for FWI Components Developing Anomaly Maps for Fire Occurrence Analysis of 1991 to 2000 fire seasons Deliverables Summary and Implications for BC Presentation Objectives
Goals and Objectives Goals : • To create current and future fire weather and fire danger scenarios for BC by using the current run of the RCM model. • To evaluate the effectiveness of Regional Climate Model for BC ….. can the RCM produce realistic fire danger projections for BC’s situation. Deliverables : # 1 - Validation of Baseline ( current 1xCO2) RCM scenarios of fire weather and fire danger conditions. # 2 - Refine RCM projections of fire weather and fire danger with considerations for terrain influences in BC.
To understand the changes in fire activity and fire danger that BC can expect under a changing climate. To determine if the drought area in BC are changing over time. Goals and Objectives Goals : Deliverables : # 4 - Develop relationships between fire weather, fire danger, fire occurrence and area burned in BC. # 5 - Validation of baseline modeling of current fire occurrence and area burned projections from the RCM using fire frequency and fire history data from BC.
To identify if Sea Surface Temperatures in the Pacific can be used to develop a Seasonal Fire Danger Prediction Tool. Goals and Objectives Goals : Deliverables : # 6 - Define the epicenter location and strength of past sea surface temperature anomalies that best relate to extreme fire danger and area burned in BC. # 7 - Define the SST Epicenter location with the strength of past fire occurrence and drought events in BC.
To incorporate RCM projections for future scenarios into Fire Occurrence Prediction models. Goals Goals and Objectives Deliverables : # 3 - Develop preliminary lightning parameterization within the RCM for BC situations. # 8 - Develop a model for BC to predict fire occurrence and drought conditions based on SST anomaly events and seasonal lag times.
Global Climate Modeling Regional Climate Model (RCM) Sea Surface Temperature (SST) BackGround 2xCO2( 2040 – 2049 ) RCM Temperature Ratio - 2xCO2 / 1xCO2
Global climate is modeled with daily General Circulation Models (GCMs) Canadian Climate Centre (CCC) Hadley Centre. Models use the concentration of carbon dioxide (CO2) to explain and measure the greenhouse effect 1 x CO2 ( 1975 – 1995 ) 2 x CO2 ( 2020 – 2040 ) 3 x CO2 ( 2080 – 2100 ) Models produce daily projections for surface temperatures relative humidity wind speeds precipitation Climate Modeling - GCMs Circumpolar SSR -2xCO2
GCMs project 1 – 50 C increase in global mean temperature by 2100 Greatest increases will be at high latitudes, over land and winter/spring Projected increases in extreme weather Observed increases across west-central Canada and Siberia over past 40 years Climate Modeling - GCMs
Climate Modeling - GCMs Projected Summer Temperature Change Between 1975-1995 and 2080-2100 Combined Effects of Projected Greenhouse Gas and Sulphate Aerosol Increases - Canadian Model
Climate Modeling - GCMs Comparing Two GCMs
Regional Climate Models (RCM) Use the GCM outputs as starting inputs Provide finer scale and shorter time steps Pickup important regional details Provide realistic scenarios of fire danger Separate runs for western and eastern Canada Climate Modeling - RCMs Seasonal Severity Rating Ratio of 2xCO2 / 1xCo2
Why Use a RCM instead of a GCM Climate Modeling - RCMs Spatial Resolution is Better Grid Cell Size is Better GCM RCM • GCM – 3.75 degree cells • RCM – 45 km cells
Climate Modeling - RCMs The projections • Summer temperatures will be warmer • Summer precipitation will be less • Fire Seasons will be longer • Fires will increase in Manitoba, Saskatchewan, Alberta and NWT Temperature Ratio of 2xCO2 / 1xCo2 Fire Weather Index Ratio: 2xCO2 / 1xCO2 Precipitation Ratio of 2xCO2 / 1xCo2
Sea Surface Temperatures Why Study Pacific Sea Surface Temperatures (SST) • Research has shown strong linkages (teleconnection) exists between weather conditions in Pacific Ocean and weather conditions on the continental North America. • Teleconnections imply that seasonal climate prediction is possible. • We know that there is a very close linkage between forest fires, area burned and weather conditions. • Slow changes in the ocean temperatures could be used for long-term seasonal fire forecasts. 1961
Sea Surface Temperatures What Factors are Important • Warming Phases in the Pacific Ocean • North Pacific Oscillation • Cool Phase : 1953 – 1976 • Warm Phase : 1977 - 1995 • Time Periods • Seasonal is better than Monthly • Time Lags • Zero to 3 month lags • Past Canadian Research • Good correlations with provincial area burned • Best correlations in Yukon, NWT and Manitoba 1961
Sea Surface Temperatures Provincial Seasonal Correlations for Area Burned for NPO Phase 1977-1995 • Correlations are generally much higher than monthly method. • Correlations are higher in high NPO phase • Highest correlations are in Yukon, NWT, Manitoba and Quebec. • Correlations are fairly flat indicating the lag could be used. Jan - Apr 1961
Sea Surface Temperatures Monthly SST Correlations for Eastern Canada for 1977 - 1995 • There is a definite relationship between area burned and seasonal SST anomalies • Correlation is 0.64 which explains about 41% of variation data • Correlations are very good considering all factors affecting area burned • Multiple Fire starts, fuels, topography, remoteness • Fire management policies, priorities, and organizational efficiencies • Statistically the correlations are significant, they are not random – above 99% level 1961
0.00 - 0.05 0.05 - 0.10 Legend 0.10 - 0.15 0.15 - 0.20 0.20 - 0.25 0.25 - 0.30 0.30 - 0.35 0.35 - 0.40 0.40 - 0.45 0.46 + Sea Surface Temperatures 0 Month Lag Monthly SST Correlations for Eastern Canada for 1977 - 1995 • Indicates spatial relationships of correlations • Definite areas of correlation in Pacific Ocean 1 Month Lag 1961 3 Month Lag
Creating RCM Projections for Western Canada Creating RCM Projections for BC Sections 1 and 2 RCM Weather Modeling SSR for Western Canada 2xCO2 ( 2040 - 2049 ) SSR for BC 2xCO2 ( 2040 - 2049 )
Uses CCC CGCM1 output as boundary conditions Develops three 10 year time slices Spatial Resolution – 45 km Temporal resolution – outputs every 6 hours Variables Details RCM for Western Canada • 1975 - 1985 ( 1 x CO2 ) • 2040 - 2049 ( 2 x CO2 ) • 2080 – 2089 ( 3 x CO2 ) • Max, min and mean temperature • Max, min and mean specific humidity • 10 m wind velocity • Precipitation ( synoptic and convective ) • Surface pressure • Other surface and upper air information
Analyze and adjust Rain, Wind and RH fields in CRCM model Generate RCM projections for western Canada from CRCM model Treat each RCM 45 km grid cell as a weather station Develop time series of noon weather observations Determine start and end of fire season at each point Use CFFDRS to generate fire danger codes Fire Danger Scenario Development RCM for Western Canada
RCM Adjustments Based on AES Weather Stations Stations are in Alberta and Saskatchewan Variables Temperature Rainfall Interval Rainfall Frequency Wind Speed Fire Danger Scenario Development RCM for Western Canada
RCM Wind Adjustments Based on AES WxStns in AB and SK Little effect in BC Zero terrain modeling Fire Danger Scenario Development RCM for Western Canada Corrected RCM Winds Uncorrected RCM Winds
Fire Seasons will start earlier in BC RCM Analysis RCM for Western Canada Current and Future Season Start Dates 1xCO2 ( 1975 – 1985 ) AES 2xCO2 - 1xCO2 3xCO2 - 1xCO2 2xCO2 ( 2040 - 2049 ) 3xCO2 ( 2080 - 2089 )
Temperature Increase in BC of 1 –3 0C by 2045 and 2 –5 0C by 2085 RCM Analysis RCM for Western Canada Current and Future Summer Temperature Differences ( Deltas ) 1xCO2 ( 1975 – 1985 ) 2xCO2 - 1xCO2 ( 2040 - 2049 ) 3xCO2 - 1xCO2 ( 2080 - 2089 )
Slight Rainfall Increasein BC RCM Analysis RCM for Western Canada Current and Future Summer Rainfall Differences ( Deltas ) 2xCO2 - 1xCO2 ( 2040 - 2049 ) 1xCO2 ( 1975 – 1985 ) 3xCO2 - 1xCO2 ( 2080 - 2089 )
Slight Increasein SSRin BC RCM Analysis RCM for Western Canada Current and Future Seasonal Severity Rating (SSR) 1xCO2 ( 1975 – 1985 ) 2xCO2 ( 2040 - 2049 ) 3xCO2 ( 2080 - 2089 )
Slight SSR Increasein BC RCM Analysis RCM for Western Canada Current and Future Seasonal Severity Rating Differences ( Deltas ) 1xCO2 ( 1975 – 1985 ) 2xCO2 / 1xCO2 ( 2040 - 2049 ) 3xCO2 / 1xCO2 ( 2080 - 2089 )
Seasonal Length Increaseof 25 - 50 days in BC RCM Analysis RCM for Western Canada Future Changes In Season Length (Deltas) 3xCO2 - 1xCO2 2xCO2 - 1xCO2
RCM for BC • Create 45 km mask for BC • Same Projected mask as used in sFMS • Lambert Conformal Conic • Create spatial grids for BC from RCM data • Uncorrected • Create 10 year scenarios of fire danger on a daily basis • 1975 - 1985 ( 1xCO2 ) • 2040 - 2049 ( 2xCO2 ) • 2080 – 2089 ( 3xCO2 ) Temperature – June 26, 1975
T2, P2, r2 Ti´, Pi´, ri´, RHi´ z2 T1, P1, r1 T3, P3, r3 zi z1 z3 d2 d1 d3 Ti, Pi, ri RCM for BC Improving the RCM for B.C • Used finer grid structure to resolve valleys • 5 km resolution • Apply elevation corrections for temperature and relative humidity • same terrain effect as in sFMS • Use simple interpolation procedure to smooth 45 km to 5 km • Adjust interpolated results for elevation • Calculate new FWI values for each 5 km cell for each day
RCM for BC Improving the RCM for B.C Does the Corrections Improve the RCM Projections for BC ? Comparing Uncorrected and Corrected RCM Daily Data Corrected RCM Data 5 km Uncorrected RCM Data 45 km Uncorrected RCM Data 45 to 5 km Temperature – June 26, 1975
RCM for BC RCM Data Created • RCM 5 km Mask for BC • Daily and Bi-monthly Weather and FWI Maps • Elevation-Corrected at 5 km • March 1st to October 30th • Three 10-year scenarios • 1975 - 1985 (1xCO2) • 2040 - 2049 (2xCO2) • 2080 - 2089 (3xCO2) • 11-year Seasonal and Monthly Weather and FWI Maps ( analysis ) • May 1st to August 31st • Elevation-Corrected at 5 km • Means and 90th Percentiles • Three 10-year scenarios • 1975 - 1985 (1xCO2) • 2040 - 2049 (2xCO2) • 2080 - 2089 (3xCO2) 90th Percentile Seasonal (May-August) FFMC Map for 1xCO2Scenario Files are : • ArcView Gridascii Files • sFMS compatible • Lambert Conformal Conic Projection • Color GIFS
Validating RCM Projections Comparing RCM Projections Sections 3 and 4 Analysis of RCM Scenarios SSR for Western Canada 2xCO2 ( 2040 - 2049 ) SSR for BC 2xCO2 ( 2040 - 2049 )
Validation of Historic to RCM Data for 1975 – 1985 ( 1xCO2) Comparing Historic and RCM Issues : • RCM does NOT predict daily weather events • forecasts monthly / yearly patterns • Best comparison • 11-year seasonal averages • 11-year monthly averages • Next best comparison • Yearly averages, then Monthly averages • Poor Comparisons • Daily and Bi-monthly
Validation of Historic to RCM Data for 1975 – 1985 ( 1xCO2) Comparing Historic and RCM Issues : • Historic Data created with ArcView / sFMS • Elevation correction • Better interpolation techniques • RCM Data created with C routines • Elevation correction
Validation of Historic to RCM Data for 1975 – 1985 ( 1xCO2) Comparing Historic and RCM Methods : • Used elevation-corrected 5 km FWI / Weather maps • Comparisons • Seasonal ( May – August ) • Monthly • Bi-monthly periods ( 15 day periods ) • Outputs • ArcView Gridascii files • Color GIFs
0.0 - 2.5 2.6 – 5.0 5.1 – 10.0 10.1 – 15.0 15.1 – 20.0 20.1 – 25.0 25.1 – 30.0 30.1 + Comparing Historic and RCM Seasonal Mean Daily 90th Percentiles Mean Daily Temperature Historic Legend RCM Maps are : 11-Year Seasonal Means (May–August), Elevation-Corrected, 5 km resolution
0 - 35 36 - 45 46 - 55 56 - 65 66 - 70 71 - 75 76 - 80 81 + Comparing Historic and RCM Seasonal Mean Daily 90th Percentiles Mean Daily RH Historic Legend RCM Maps are : 11-Year Seasonal Means (May–August), Elevation-Corrected, 5 km resolution
0.0 – 0.1 0.11 - .0.5 0.51 – 1.5 1.51 – 3.0 3.1 - 5.0 5.1 – 10.0 10.1 – 20.0 20.1 + Comparing Historic and RCM Seasonal Mean Daily 90th Percentiles Mean Daily Rainfall Historic Legend RCM Maps are : 11-Year Seasonal Means (May–August), Elevation-Corrected, 5 km resolution
0 – 3 4 - 9 10 - 12 13 - 15 16 - 20 21 - 25 26 - 30 31 + Comparing Historic and RCM Seasonal Mean Daily 90th Percentiles Mean Daily Wind Speed Historic Legend RCM Maps are : 11-Year Seasonal Means (May–August), Elevation-Corrected, 5 km resolution
0 - 50 51 – 60 61 - 71 72 - 75 76 - 79 80 – 83 84 - 87 88 + Comparing Historic and RCM Seasonal Mean Daily 90th Percentiles Mean Daily FFMC Historic Legend RCM Maps are : 11-Year Seasonal Means (May–August), Elevation-Corrected, 5 km resolution
0 - 7 8 - 14 15 - 28 29 - 42 43 - 56 57 - 70 71 - 90 91 + Comparing Historic and RCM Seasonal Mean Daily 90th Percentiles Mean Daily DMC Historic Legend RCM Maps are : 11-Year Seasonal Means (May–August), Elevation-Corrected, 5 km resolution
0 - 25 26 - 50 51 - 100 101 - 150 151 - 250 251 - 350 351 - 450 451 + Comparing Historic and RCM Seasonal Mean Daily 90th Percentiles Mean Daily DC Historic Legend RCM Maps are : 11-Year Seasonal Means (May–August), Elevation-Corrected, 5 km resolution
0 - 10 11 - 20 21 - 30 31 - 50 51 - 60 61 - 80 71 - 100 101 + Comparing Historic and RCM Seasonal Mean Daily 90th Percentiles Mean Daily BUI Historic Legend RCM Maps are : 11-Year Seasonal Means (May–August), Elevation-Corrected, 5 km resolution
0 1 2 3 4 - 5 6 - 10 11 – 15 16 + Comparing Historic and RCM Seasonal Mean Daily 90th Percentiles Mean Daily ISI Historic Legend RCM Maps are : 11-Year Seasonal Means (May–August), Elevation-Corrected, 5 km resolution