Download
1 / 78
780 likes | 902 Views
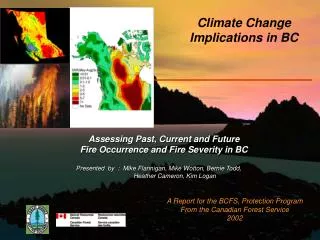
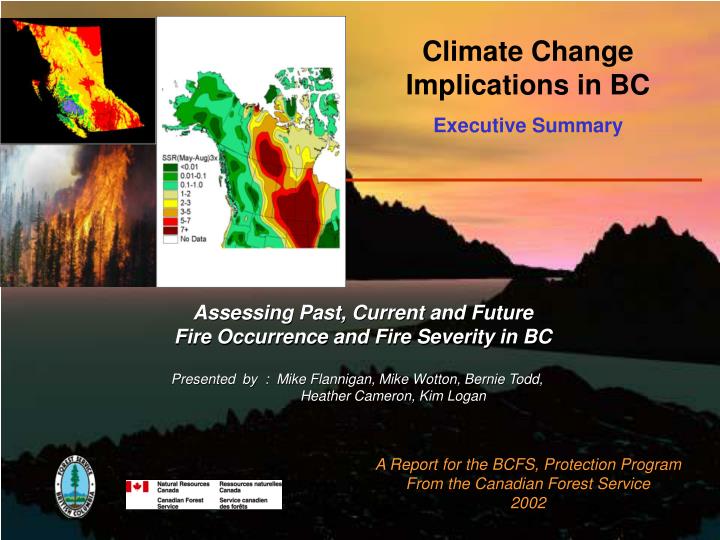
Climate Change Implications in BC Executive Summary. Assessing Past, Current and Future Fire Occurrence and Fire Severity in BC. Presented by : Mike Flannigan, Mike Wotton, Bernie Todd, Heather Cameron, Kim Logan. A Report for the BCFS, Protection Program

E N D
Climate Change Implications in BCExecutive Summary Assessing Past, Current and Future Fire Occurrence and Fire Severity in BC Presented by : Mike Flannigan, Mike Wotton, Bernie Todd, Heather Cameron, Kim Logan A Report for the BCFS, Protection Program From the Canadian Forest Service 2002
Collaborative Research Agreement between British Columbia Ministry of Forest, Protection Program NRCan - Canadian Forest Service Collaborators / Contacts BCFS – Judi Beck, John Flanagan CFS – Mike Flannigan, Brian Stocks, Mike Wotton, Bernie Todd, Heather Cameron, Kim Logan History Started July, 2000 The Project Mike Flannigan Mike Wotton Bernie Todd Heather Cameron Kim Logan Climate Change Implications in British Columbia Assessing Past, Current and FutureFire Occurrence and Fire Severity in British Columbia
Project Goals Background on Climate Change Future Climate Data RCM Projections for Western Canada and BC Validating RCM Projections – Historic vs RCM Comparing the Amount of Change in Future Climate Projections Historical Fire Occurrence and Weather Analysis Defining Fire Danger Relationships by BEC Zones Fire Season Analysis Relationships between SST and Fire Seasons Seasonal Fire Occurrence Prediction Tool Seasonal Drought Analysis Anomaly Map Approach for Fire Occurrence and FWI Components Summary and Implications for BC Presentation Objectives
Goals • To create current and future fire weather and fire danger scenarios for BC by using the current run of the Regional Climate Model ( RCM ) . • To evaluate the effectiveness of RCM for BC ….. can the RCM produce realistic fire danger projections for BC’s situation? • To understand the changes in fire activity and fire danger that BC can expect under a changing climate…… historic analysis. • To identify if Sea Surface Temperatures in the Pacific can be used to develop a Seasonal Fire Danger Prediction Tool. • To determine if the drought areas in BC are changing over time
Causes of Climate Change Global Climate Modeling (GCM) Regional Climate Model (RCM) Sea Surface Temperature (SST) BackGround 2xCO2( 2040 – 2049 ) RCM Temperature Ratio - 2xCO2 / 1xCO2
Variations in solar radiation due to changes in orbital parameters and solar output Volcanism Atmospheric and land surface changes greenhouse effect changes in cloudiness change in albedo sulfates Causes of Climate Change
23.5 o N N N N Equator Equator Equator Equator S S S S Causes of Climate Change Eccentricity of the Orbit Precession of the Equinoxes Almost Elliptical Almost Circular Mar 21 Perihelian Today June 21 Dec 21 Sept 21 Periodicity 100,000 years Dec 21 Obliquity of the Axis 5,500 Years Ago Mar 21 Sept 21 June 21 December 21 June 21 Tilt 24.5 o 11,000 Years Ago Sept 21 Plane of the Orbit June 21 Dec 21 Mar 21 Tilt 21.5 o Plane of the Orbit Periodicity 21,000 years Periodicity 41,000 years
The Greenhouse Effect Causes of Climate Change Primary Contributors To The Natural Greenhouse Effect Reflected Energy Outgoing Energy ~25% ~10% ~65% Incoming Energy Energy Trapped By Greenhouse Gases
Causes of Climate Change Global Trends In Fossil Fuel CO2 Emissions Trends in CO2 Concentrations (Past 1000 Years)
0.8 0.6 0.4 0.2 0 -0.2 -0.4 -0.6 1860 1880 1900 1920 1940 1960 1980 2000 Year Causes of Climate Change Global Temperature Change 1860 - 1998 Projected CO2 Concentrations ( to 2100) High Estimate (IS92e) Intermediate Estimate (IS92a) Degrees C Low Estimate (IS92c)
Global climate is modeled with daily General Circulation Models (GCMs) Canadian Climate Centre (CCC) Hadley Centre. Models use the concentration of carbon dioxide (CO2) to explain and measure the greenhouse effect 1 x CO2 ( 1975 – 1995 ) 2 x CO2 ( 2040 – 2060 ) 3 x CO2 ( 2080 – 2100 ) Models produce daily projections for surface temperatures relative humidity wind speeds precipitation Climate Modeling - GCMs Circumpolar SSR -2xCO2
GCMs project 1 – 50 C increase in global mean temperature by 2100 Greatest increases will be at high latitudes, over land and winter/spring Projected increases in extreme weather Observed increases across west-central Canada and Siberia over past 40 years Climate Modeling - GCMs Annual Surface Air Temperature Trends 1961-1990 Source: Atmospheric Environment Service/ University of East Anglia
Climate Modeling - GCMs Observed and Modeled Global Temperature Change Projected Summer Temperature Change Between 1975-1995 and 2080-2100 Combined Effects of Projected Greenhouse Gas and Sulphate Aerosol Increases - Canadian Model
Use the GCM outputs as starting inputs Provide finer scale and shorter time steps Pickup important regional details Provide realistic scenarios of fire danger Separate runs for western and eastern Canada Climate Modeling – Regional Climate Models (RCM) Seasonal Severity Rating Ratio of 2xCO2 / 1xCo2 Spatial Resolution is Better Grid Cell Size is Better GCM – 4 degrees RCM – 45 km
Climate Modeling - RCMs The projections • Summer temperatures will be warmer • Summer precipitation will be less • Fire Seasons will be longer • Fires will increase in Manitoba, Saskatchewan, Alberta and NWT Temperature Ratio of 2xCO2 / 1xCo2 Fire Weather Index Ratio: 2xCO2 / 1xCO2 Precipitation Ratio of 2xCO2 / 1xCo2 Preliminary RCM Model Outputs
Sea Surface Temperatures Why Study Pacific Sea Surface Temperatures (SST) • Research has shown strong linkages (teleconnection) exists between weather conditions in Pacific Ocean and weather conditions on the continental North America. • Teleconnections imply that seasonal climate prediction is possible. • We know that there is a very close linkage between forest fires, area burned and weather conditions. • Slow changes in the ocean temperatures could be used for long-term seasonal fire forecasts. 1961
Sea Surface Temperatures Monthly SST Correlations for Eastern Canada for 1977 - 1995 • There is a definite relationship between area burned and seasonal SST anomalies • Correlation is 0.64 which explains about 41% of variation data • Correlations are very good considering all factors affecting area burned • Multiple Fire starts, fuels, topography, remoteness • Fire management policies, priorities, and organizational efficiencies • Statistically the correlations are significant, they are not random – above 99% level 1961 3 Month Lag
Creating RCM Projections for Western Canada Creating RCM Projections for BC Sections 1 and 2 RCM Weather Modeling SSR for Western Canada 2xCO2 ( 2040 - 2049 ) SSR for BC 2xCO2 ( 2040 - 2049 )
Uses CCC CGCM1 output as boundary conditions Develops three 10 year time slices Spatial Resolution – 45 km Temporal resolution – outputs every 6 hours Variables Details RCM for Western Canada • 1975 - 1985 ( 1 x CO2 ) • 2040 - 2049 ( 2 x CO2 ) • 2080 – 2089 ( 3 x CO2 ) • Max, min and mean temperature • Max, min and mean specific humidity • 10 m wind velocity • Precipitation ( synoptic and convective ) • Surface pressure • Other surface and upper air information
Analyze and adjust Rain, Wind and RH fields in CRCM model Generate RCM projections for western Canada from CRCM model Treat each RCM 45 km grid cell as a weather station Develop time series of noon weather observations Determine start and end of fire season at each point Use CFFDRS to generate fire danger codes Fire Danger Scenario Development RCM for Western Canada
Fire Seasons will start earlier in BC RCM Analysis RCM for Western Canada Current and Future Season Start Dates 1xCO2 ( 1975 – 1985 ) AES 2xCO2 - 1xCO2 3xCO2 - 1xCO2 2xCO2 ( 2040 - 2049 ) 3xCO2 ( 2080 - 2089 )
Temperature Increase in BC of 1 –3 0C by 2045 and 2 –5 0C by 2085 RCM Analysis RCM for Western Canada Current and Future Summer Temperature Differences ( Deltas ) 1xCO2 ( 1975 – 1985 ) 2xCO2 - 1xCO2 ( 2040 - 2049 ) 3xCO2 - 1xCO2 ( 2080 - 2089 )
Slight Increasein SSRin BC RCM Analysis RCM for Western Canada Current and Future Seasonal Severity Rating (SSR) 1xCO2 ( 1975 – 1985 ) 2xCO2 ( 2040 - 2049 ) 3xCO2 ( 2080 - 2089 )
T2, P2, r2 Ti´, Pi´, ri´, RHi´ z2 T1, P1, r1 T3, P3, r3 zi z1 z3 d2 d1 d3 Ti, Pi, ri Improving RCM for BC • Apply elevation corrections for temperature and relative humidity; then re-calculate FWI values • Same terrain effect as in sFMS • User finer grid structure to resolve valleys • 45km to 5 km resolution • Create 45 km and 5 km masks for BC • Same Projected mask as used in sFMS • Create spatial grids for BC from RCM data • Corrected • Create daily scenarios of fire danger • 1975 - 1985 ( 1xCO2 ) • 2040 - 2049 ( 2xCO2 ) • 2080 – 2089 ( 3xCO2 )
Improving RCM for BC Does the Corrections Improve the RCM Projections for BC ? Comparing Uncorrected and Corrected RCM Daily Data Corrected RCM Data 5 km Uncorrected RCM Data 45 km Uncorrected RCM Data 45 to 5 km Temperature – June 26, 1975
RCM Data Created for BC • RCM 5-km Mask for BC • Daily and Bi-monthly Weather and FWI Maps • Elevation-Corrected at 5 km • March 1st to October 30th • Three 10-year scenarios • 1975 - 1985 (1xCO2) • 2040 - 2049 (2xCO2) • 2080 - 2089 (3xCO2) • 11-year Seasonal and Monthly Weather and FWI Maps ( analysis ) • May 1st to August 31st • Elevation-Corrected at 5 km • Means and 90th Percentiles • Three 10-year scenarios • 1975 - 1985 (1xCO2) • 2040 - 2049 (2xCO2) • 2080 - 2089 (3xCO2) 90th Percentile Seasonal (May-August) FFMC Map for 1xCO2Scenario Files are : • ArcView Gridascii Files • sFMS compatible • Lambert Conformal Conic Projection • Color GIFS
Validating RCM Projections Comparing RCM Projections Sections 3 and 4 Analysis of RCM Scenarios SSR for Western Canada 2xCO2 ( 2040 - 2049 ) SSR for BC 2xCO2 ( 2040 - 2049 )
Validation of Historic to RCM Data for 1975 – 1985 ( 1xCO2Scenario ) Comparing Historic and RCM Issues : • RCM does NOT predict daily weather events • forecasts monthly / yearly patterns • Best comparison • 11-year seasonal averages • 11-year monthly averages • Next best comparison • Yearly averages, then Monthly averages • Poor Comparisons • Daily and Bi-monthly
0.0 - 2.5 2.6 – 5.0 5.1 – 10.0 10.1 – 15.0 15.1 – 20.0 20.1 – 25.0 25.1 – 30.0 30.1 + Comparing Historic and RCM Seasonal Mean Daily 90th Percentiles Mean Daily Temperature Historic Legend RCM Maps are : 11-Year Seasonal Means (May–August), Elevation-Corrected, 5 km resolution
0 - 35 36 - 45 46 - 55 56 - 65 66 - 70 71 - 75 76 - 80 81 + Comparing Historic and RCM Seasonal Mean Daily 90th Percentiles Mean Daily RH Historic Legend RCM Maps are : 11-Year Seasonal Means (May–August), Elevation-Corrected, 5 km resolution
0.0 – 0.1 0.11 - .0.5 0.51 – 1.5 1.51 – 3.0 3.1 - 5.0 5.1 – 10.0 10.1 – 20.0 20.1 + Comparing Historic and RCM Seasonal Mean Daily 90th Percentiles Mean Daily Rainfall Historic Legend RCM Maps are : 11-Year Seasonal Means (May–August), Elevation-Corrected, 5 km resolution
0 - 50 51 – 60 61 - 71 72 - 75 76 - 79 80 – 83 84 - 87 88 + Comparing Historic and RCM Seasonal Mean Daily 90th Percentiles Mean Daily FFMC Historic Legend RCM Maps are : 11-Year Seasonal Means (May–August), Elevation-Corrected, 5 km resolution
0 - 7 8 - 14 15 - 28 29 - 42 43 - 56 57 - 70 71 - 90 91 + Comparing Historic and RCM Seasonal Mean Daily Mean Daily 90th Percentiles DMC Historic Legend RCM Maps are : 11-Year Seasonal Means (May–August), Elevation-Corrected, 5 km resolution
0.0 – 0.01 0.01 – 0.1 0.11 – 1.0 1.1 – 2.0 2.1 – 3.0 3.1 – 5.0 5. 1 - 7.0 7.1+ Comparing Historic and RCM Seasonal Mean Daily Mean Daily 90th Percentiles DSR Historic Legend RCM Maps are : 11-Year Seasonal Means (May–August), Elevation-Corrected, 5 km resolution
0 - 50 51 – 60 61 - 71 72 - 75 76 - 79 80 – 83 84 - 87 88 + Comparing Historic and RCM Monthly - August Mean Daily 90th Percentiles Mean Daily FFMC Historic Legend RCM Maps are : 11-Year Monthly Means, Elevation-Corrected, 5 km resolution
Analysis of RCM Scenarios( 1xCO2 , 2xCO2 , 3xCO2) Comparing RCM Projections Methods : • Used elevation-corrected 5 km FWI / Weather maps • Comparisons • Seasonal ( May – August ) • Monthly • Outputs • ArcView Gridascii files • Color GIFs
0.0 - 2.5 2.6 – 5.0 5.1 – 10.0 10.1 – 15.0 15.1 – 20.0 20.1 – 25.0 25.1 – 30.0 30.1 + Legend >= -3.1 + -2.1 to –3.0 -1.1 to -2.0 -1.0 to 1.0 1.1 to 2.0 2.1 to 3.0 >= 3.1 Comparing RCM Projections Seasonal Means Temperature 1xCO2 2xCO2 3xCO2 Legend 2xCO2 –1xCO2 3xCO2 –1xCO2 Deltas Temperature Increase of 1 – 3 0C by 2045 and 3 + 0C by 2085 Maps are : 10-Year Seasonal Means (May-August), Elevation-Corrected, 5 km resolution
0 - 35 36 - 45 46 - 55 56 - 65 66 - 70 71 - 75 76 - 80 81 + Legend >= - 6 + -4 to –5 -2 to – 3 -1 to 1 2 to 3 4 to 5 >= 6 Comparing RCM Projections Seasonal Means RH 1xCO2 2xCO2 3xCO2 Legend 2xCO2 –1xCO2 3xCO2 –1xCO2 Deltas RH Increase of 2 –3 % by 2045 and 2 –3 % by 2085 Maps are : 10-Year Seasonal Means (May-August), Elevation-Corrected, 5 km resolution
0 - 50 51 – 60 61 - 71 72 - 75 76 - 79 80 – 83 84 - 87 88 + Legend >= - 6 + -4 to –5 -2 to – 3 -1 to 1 2 to 3 4 to 5 >= 6 Comparing RCM Projections Seasonal Means FFMC 1xCO2 2xCO2 3xCO2 Legend 2xCO2 –1xCO2 3xCO2 –1xCO2 Deltas FFMC Mean Increase of 2 – 3 by 2045 and 2 – 3 by 2085 Maps are : 10-Year Seasonal Means (May-August), Elevation-Corrected, 5 km resolution
0 - 50 51 – 60 61 - 71 72 - 75 76 - 79 80 – 83 84 - 87 88 + Legend >= - 6 + -4 to –5 -2 to – 3 -1 to 1 2 to 3 4 to 5 >= 6 Comparing RCM Projections Seasonal Mean 90th Percentiles FFMC 1xCO2 2xCO2 3xCO2 Legend 2xCO2 –1xCO2 3xCO2 –1xCO2 Deltas FFMC 90th Increase of 2 – 3 by 2045 and 2 – 3 by 2085 Maps are : 10-Year Seasonal Means (May-August), Elevation-Corrected, 5 km resolution
0.0 – 0.01 0.01 – 0.1 0.11 – 1.0 1.1 – 2.0 2.1 – 3.0 3.1 – 5.0 5. 1 - 7.0 7.1+ Legend >= - 1.1 + -0.61 to -1.0 -0.31 to – 0.60 -0.3 to 0.3 0.31 to 0.60 0.61 to 1.0 >= 1.1 Comparing RCM Projections Seasonal Means DSR 1xCO2 2xCO2 3xCO2 Legend 2xCO2 –1xCO2 3xCO2 –1xCO2 Deltas DSR Mean Increase of Zero by 2045 and Zero by 2085 Maps are : 10-Year Seasonal Means (May-August), Elevation-Corrected, 5 km resolution
0.0 – 0.01 0.01 – 0.1 0.11 – 1.0 1.1 – 2.0 2.1 – 3.0 3.1 – 5.0 5. 1 - 7.0 7.1+ Legend >= - 1.1 + -0.61 to -1.0 -0.31 to – 0.60 -0.3 to 0.3 0.31 to 0.60 0.61 to 1.0 >= 1.1 Comparing RCM Projections Seasonal Mean 90th Percentiles DSR 1xCO2 2xCO2 3xCO2 Legend 2xCO2 –1xCO2 3xCO2 –1xCO2 Deltas DSR 90th Increase of 2 – 3 by 2045 and 2 – 3 by 2085 Maps are : 10-Year Seasonal Means (May-August), Elevation-Corrected, 5 km resolution
0.0 – 0.01 0.01 – 0.1 0.11 – 1.0 1.1 – 2.0 2.1 – 3.0 3.1 – 5.0 5. 1 - 7.0 7.1+ Legend >= - 1.1 + -0.61 to -1.0 -0.31 to – 0.60 -0.3 to 0.3 0.31 to 0.60 0.61 to 1.0 >= 1.1 Comparing RCM Projections Seasonal Mean 90th Percentiles for August DSR 1xCO2 2xCO2 3xCO2 Legend 2xCO2 –1xCO2 3xCO2 –1xCO2 Deltas DSR 90th Increase of 0.5 to 1.0 by 2045 and 0.5 to 1.0+ by 2085 Maps are : 10-Year Seasonal Means (May-August), Elevation-Corrected, 5 km resolution
Historical Fire Occurrence Analysis 1950 to 2000 Historical Fire / Weather Analysis 1953 to 2000 Sections 5 and 6 Historical Fire Occurrence Analysis by BEC Zones
Historical Analysis AT Alpine Tundra BG Bunch Grass BWBS Boreal White and Black Spruce CDF Coastal Douglas Fire CWH Coastal Western Hemlock ESSF Englemann Spruce -- Subalpine Fir ICH Interior Cedar– Hemlock IDF Interior Douglas Fir MH Mountain Hemlock MS Montane Spruce PP Ponderosa Pine SBPS Sub-boreal Pine – Spruce SBS Sub-Boreal Spruce SWB Spruce – Willow -- Birch Biogeoclimatic (BEC) Zones
Historical Analysis Fire Occurrence and Area Burned – 1950 to 2000 All Fires Fewer Fires in Last 5 Years Area Burned has Decreased over Time
Historical Analysis Fire Occurrence by BEC Zones Most Fires Occur in BEC Zones IDF, ICH, ESSF, SBS and CWH All Fires
Historical Analysis Fire Occurrence by BEC Zones Seasonal Variation in Fire Occurrence for BEC Zone IDF ( July 15th to Aug 15th ) All Fires
Use 5 km resolution Develop Daily Grids ( sFMS ) Historic – uses sFMS terrain correction April to September 2013 grids per year 1953 – 2000 ( 48 yrs ) Develop Bi-monthly Summary 780 Stats Maps per year Spatial Statistics Percentiles are for each cell Represents a Wealth of Historical Data Historical Data Creation Methods Used Data Sets Used • Weather : • 1953 – 1970 : Apr to Sept ( AES ) • 1971 – 1989 : April ( AES ) • : May to Sept ( BCFS ) • 1990 – 2000 : April to Sept ( BCFS ) • Fire : 1950 – 2000 : BCFS data • Fuel : Biogeoclimatic zones
Historical Data Creation 90th Percentile FFMC Maps for Aug 1st to 15th Period 1956 1953 1955 1961 1959 1960