Download
1 / 42
420 likes | 570 Views
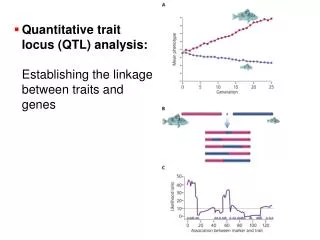
Introduction to Quantitative Trait Loci Linkage and Association Studies. Lon Cardon Wellcome Trust Centre for Human Genetics University of Oxford Pak Sham Institute of Psychiatry King’s College London Stacey Cherny Both, and then some. QTL Mapping: Morning Schedule.

E N D
Introduction to Quantitative Trait Loci Linkage and Association Studies Lon Cardon Wellcome Trust Centre for Human Genetics University of Oxford Pak Sham Institute of Psychiatry King’s College London Stacey Cherny Both, and then some
QTL Mapping: Morning Schedule 09.00 – 10.00 Linkage Theory (overview) Sham 10.00 – 10.30 Illustrative application Cardon 11.00 – 11.30 Association/Linkage Disequilibrium Theory Sham 11.30 – 12.15 Application Cherny 12.15 – 12.30 Interpreting the results Cardon • F:\lon\fulker_paper99.pdf • Fourteenth International Twin Course (Advanced): • Boulder, Colorado, March 2000
LOD Positional Cloning of Complex Traits Genetics Chromosome Region Association Study Sib pairs Genomics Candidate Gene Selection/ Polymorphism Detection Mutation Characterization/ Functional Annotation Physical Mapping/ Sequencing
Genome Screens for Linkage in Sib-pairs In 1997/98, > 20 genome screens published using sib-pairs - Diabetes (IDDM + NIDDM) - Asthma - Osteoporosis - Obesity - Multiple Sclerosis - Epilepsy - Inflammatory Bowel Disease - Celiac Disease - Psychiatric Disorders - Behavioral Traits - others... Many more studies of specific loci, candidate gene regions Scan Rate at least 2-fold greater in 1998/1999
Disequilibrium Mapping • 100’s candidate gene studies every year • Replications rare • Genome-wide SNP maps expected in late 2001 (300,000 SNPs; ~ 1 SNP/10 kb) • Applications in epidemiology, drug design, functional assessment, …
Likelihood for Variance Components Applications where yi is the vector of phenotypes for the ith family, Ei is a function of polygenic effects, environmental effects, major loci, interactions, etc., and m may be used to incorporate a wide range of covariates, including association/disequilibrium parameters. Lange, Westlake & Spence, AJHG, 1976
Linear Model of Association (Fulker et al, AJHG, 1999) Biometrical basis Variance model (linkage) pijk = proportion of alleles shared ibd at marker s2a = additive genetic variance parameter s2g = polygenic (residual) variance parameter s2e = environmental (residual) variance parameter Means model (association) Population association is parameterized independent of linkage (unlike TDT)
Application: ACE • British population • Circulating ACE levels • Normalized separately for males / females • 10 di-allelic polymorphisms • 26 kb • Common • In strong Linkage disequilibrium • Keavney et al, HMG, 1998
Angiotensin-1 Converting Enzyme Keavney et al. (1999) Hum Mol Gen, 7:1745-1751
Angiotensin-1 Converting Enzyme Keavney et al. (1999) Families 83 extended families 4 - 18 members/family age: 19-90 years Families ascertained for study of blood pressure Phenotype: Plasma ACE activity, standardized within gender No correlation between ACE and SBP or DBP
ACE Markers and Disequilibrium Data from Keavney et al. (1999) Hum Mol Gen, 7:1745-1751
Angiotensin Converting Enzyme Marker/IBD Files • F:\lon\2000\linkage.mx • F:\lon\2000\marker*.mx
2a bb Bb BB GenotypeGenetic Value BB Bb bb a 0 -a Between Pairs Model of Association (Fulker et al, AJHG, 1999) Biometrical Model Between Pair Expectations G1 G2 A1 A2 Mean BB BB a a a BB Bb a 0 a/2 BB bb a -a 0 Bb BB 0 a a/2 Bb Bb 0 0 0 Bb bb 0 -a -a/2 bb BB -a a 0 bb Bb -a 0 -a/2 bb bb -a -a -a • Genotype-phenotype associations between pairs may result from allelic • association or from population substructure
2a bb Bb BB GenotypeGenetic Value BB Bb bb a 0 -a Within Model of Association (Fulker et al, AJHG, 1999) Biometrical Model Within Expectations G1 G2 A1 A2 Diff1 Diff2 BB BB a a 0 0 BB Bb a 0 a/2 -a/2 BB bb a -a a -a Bb BB 0 a -a/2 a/2 Bb Bb 0 0 0 0 Bb bb 0 -a a/2 -a/2 bb BB -a a -a a bb Bb -a 0 -a/2 a/2 bb bb -a -a 0 0 • Genotype-phenotype associations within pairs unaffected by sampling artifacts • Difference = 0 unless 1 parent heterozygous (cf. TDT)
Parameter Expectations Let a = additive genetic value D = disequilibrium coef between q1, m1 alleles [P(m1q1)-P(m1)P(q1)] r = frequency m1 allele (s = 1 – r) p = frequency q1 allele (q = 1 – p) R = correlation between numbered alleles at marker and QTL k = population strata counter
Variance Components Association Model - Obvious Uses - Test of linkage only (typical VC) s2a = 0 Test of substructure: bb = bw Powerful test in absence of stratification: ba= bb+w = 0 Test of linkage in presence of association: s2a = 0 (bafree)
Variance Components Test for Linkage Disequilibrium - Power of Testing Linkage vs LD -
T-5991C T-3892C T-93C G2215A G2350A A-5466C A-240T T1237C I/D 4656(CT)3/2 Evidence for Linkage: Full Sample
T-5991C T-3892C T-93C G2215A G2350A A-5466C A-240T T1237C I/D 4656(CT)3/2 Evidence Against Complete LD: Full Sample
T-5991C T-3892C T-93C G2215A G2350A A-5466C A-240T T1237C I/D 4656(CT)3/2 Evidence for Association: Full Sample
T-5991C T-3892C T-93C G2215A G2350A A-5466C A-240T T1237C I/D 4656(CT)3/2 Drawing Conclusions: Full Sample
ACE Example Summary • Agrees with haplotype analysis • Distinguishes complete and incomplete disequilibrium • Measure of distance for incomplete LD • Indicator of trait allele frequencies • Typical or fairy-tale?
Useful diagnostics • Fit association and linkage models separately • Provide indicator of distance • Minimum D’ (D’min) • Select next markers • Range for QTL alleles (pmin, pmax)
TATATTAIA3 TATATCGIA3 TATATTGIA3 CCCTCCGDG2 CCCTCCADG2 TATAT CADG2 CADG2 TACAT Haplotype Analysis • 3 clades • All common haplotypes • >90% of all haplotypes • “B” = “C” • Equal phenotypic effect • Functional variant on right • Keavney et al (1998) A B C
The Spielman TDT • Traditional case-control • Compare allele frequencies in two samples • Cases and controls must be one population • Heterozygous parents • Parental alleles are the study population • Population allele frequencies fixed • 50:50, independent of original • Test for excess among affected offspring
1/2 3/4 1/3 Transmission/Disequilibrium Test TDT based on (T - NT)2/(T+NT) • TDT uses only heterozygous parents • Consequence: at different markers with variable allele frequencies, • analyses are based on different subsets of overall sample => • difficulties for localization • TDT evaluates linkage in presence of association; ie., joint test • Consequence: given positive evidence, cannot distinguish between • strong linkage or strong association • Several sibling-based extensions developed
Family-based Association Methods for Quantitative Traits Primary aim: association test free of pop. sub-structure effects Allison, D.B., AJHG, 1997 Selected parent-offspring trios Rabinowitz, D. Hum Hered, 1997 Nuclear families Fulker, D. W. et al. AJHG, 1999 Sib-pairs without parents Elston, R. C. et al. AJHG, 1999 General pedigrees (linkage) Allison, D. B. et al. AJHG, 1999 Sibships with/without parents (linkage) Abecasis, G. et al. AJHG 2000 General pedigrees with/without parents Cardon, L.R. Hum Hered 2000 Sib-pairs with GxE, epistatic interactions Monks, S. et al. abstract 1999 Nuclear families
2a Genotype Genetic Value BB Bb bb a d -a Quantitative Genetic Model d bb midpoint Bb BB
Simple Association Model • Fit by linear regression • Phenotype (yij) • Mean () • Number of ‘B’ alleles at marker (gij) • Evidence for association when a 0
Linear Model of Association in Sib-pairs bi and wij are defined on the basis of the marker genotype i.e., bb and bw are f(genotype(QTL), genotype(marker),Dmq)