Download
1 / 11
110 likes | 124 Views
Graphing Linear Equations. Chapter 4 Section 2. Graphing Linear Equations. Steps to Graphing Linear Equations: 1. Rewrite the equation in function form (solve for y) 2. Draw an x-y table 3. Find what y is when x= -2, -1, 0, 1, 2 4. Rewrite the x and y values into ordered pairs

E N D
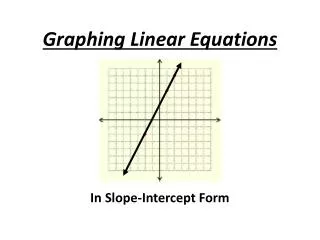
Graphing Linear Equations Chapter 4 Section 2
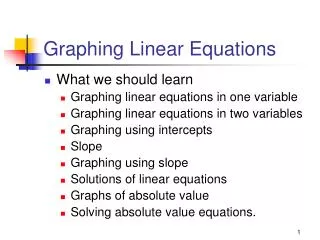
Graphing Linear Equations • Steps to Graphing Linear Equations: • 1. Rewrite the equation in function form (solve for y) • 2. Draw an x-y table • 3. Find what y is when x= -2, -1, 0, 1, 2 • 4. Rewrite the x and y values into ordered pairs • 5. Plot the ordered pairs on the graph
Graphing Linear Equations: Example -8x+4y=-12
Horizontal Lines • An equation is a horizontal line if it does not have an x variable. (only has a y variable) • Example: • y=2 • y=-1 • y=5 • y=0
Vertical Lines • An equation is a vertical line if it does not have a y variable (only has an x variable) • Example: • x=2 • x=-1 • x=5 • x=0
Class Work • Worksheet
Homework • Page 214 #12, 13, 15, 16, 32- 34, 36, 37, 40, 44, 45