Download
1 / 76
770 likes | 945 Views
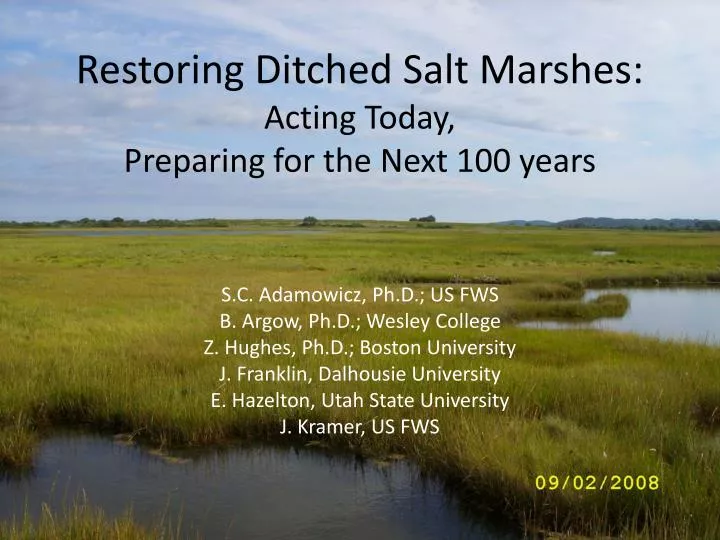
Restoring Ditched Salt Marshes: Acting Today, Preparing for the Next 100 years. S.C. Adamowicz, Ph.D.; US FWS B. Argow, Ph.D.; Wesley College Z. Hughes, Ph.D.; Boston University J. Franklin, Dalhousie University E. Hazelton, Utah State University J. Kramer, US FWS. Overview.

E N D
Restoring Ditched Salt Marshes: Acting Today, Preparing for the Next 100 years S.C. Adamowicz, Ph.D.; US FWS B. Argow, Ph.D.; Wesley College Z. Hughes, Ph.D.; Boston University J. Franklin, Dalhousie University E. Hazelton, Utah State University J. Kramer, US FWS
Overview • Introduction • Concepts • Ditch types & history • Predicted Future Conditions • Previous Restoration Efforts • New Techniques
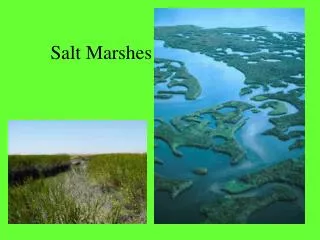
Introduction • Salt marshes • Are extensive ecosystems dominated by halophytic grasses • Are a highly productive • Provide important ecosystem services • Fish & wildlife habitat • Storm surge protection • Nutrient cycling • Flood attenuation • Shoreline protection • Marine fishery nurseries • C-sequestration
Important Concepts • Resilience • Salt marsh capital • Self-sustaining processes
Resilience Ecosystems possessing high resilience can be pushed to extremes without reorganizing into a different form of stable state. Systems lacking resilience can be “pushed” into an alternative stable state, of which there may be more than one.
Concepts cont • Salt Marsh Capital S. Alterniflora Growth zone MSL
Concepts cont • Salt Marsh Capital S. Alterniflora Growth zone MSL
Concepts cont • Self-sustaining ecosystem processes
Ditching History • Colonial Times • Public Works Administration • OMWM • Other misc (boat access, pipelines, etc)
Colonial Ditching • Purpose- salt hay production, pasturing • Characteristics – • “step across” x 1 ft deep • Boundary ditches 3 ft deep • Spacing: “able to turn a horse” ~60 ft • Methods of construction • Hand digging
Recipe to make Manure. Take the Soil and Mud, which you cutt up and throw out when you dig Ditches in a Salt Marsh, and put 20 Load of it in a heap. (John Adams, 1771) John Adams by John Trumbull; wikitree.com
Public Works Ditching • Purpose – mosquito control • Characteristics- • 1- many feet deep • 1- many feet wide • Methods: see subsequent slides • Bourn & Cottam 1950 By mid-century ~90% of salt marshes from Maine to Virginia had been ditched
Botsford Spade Photos Courtesy CT DEP: Paul Capitosto
Hay knife Crew Hay knife
Hammonasett State Park, CT 90 ft spacing
Prime Hook NWR 150 ft spacing
Stewart B. McKinney NWR 100 ft spacing
Rumstick Point, RI 90-130 ft spacing
Effects of Ditches: Drainage • Redfield 1972:“The general effect of ditching is to reduce the natural drainage system by providing an alternate route for the flow of water.” Adamowicz 2002
Ditch Effects: Elevation & Sedimentation • LeMay (2007) • Natural marsh: creeks fill first then sheet flow covers the marsh • Ditched marsh: interior fills first & remains flooded for longer period of time • Increased ditch length within a given area correlated with decreased elevation • Reduced elevation and increased inundation did not more sedimentation • Ditched marshes were net erosive environments
Ditch Effects: Elevation Total elevation and accretion reduced at ditched sites Erwin et al. unpublished data
Ditch Effects: Biodiversity • Corman(2011): • natural creeks have higher species richness • No change in density BUT: • Mummichogs preferred upper creeks but lower ditches • Clarke et al. (1984): • Shorebirds, wading birds, terns, swallows & crows deprived of foraging areas (inadequate foraging areas)
OMWM: Open Marsh Water Management Ditches • Open Marsh Water Management • Construct shallow ditches and pools to link fish reservoirs to mosquito breeding areas • Keep fish on the marsh in between tides • Use natural control mechanisms (fish, water regulation) to reduce mosquito production
East Coast Sea Level Changes • Sea Levels Online http://tidesandcurrents.noaa.gov/sltrends/sltrends.html
Mean Sea Level Trend8534720 Atlantic City, New Jersey The mean sea level trend is 3.99 millimeters/year with a 95% confidenceinterval of +/- 0.18 mm/yr based on monthly mean sea level data from 1911 to 2006 which is equivalent to a change of 1.31 feet in 100 years. http://tidesandcurrents.noaa.gov/sltrends/sltrends_station.shtml?stnid=8534720
Mean Sea Level Trend8557380 Lewes, Delaware The mean sea level trend is 3.20 millimeters/year with a 95% confidence interval of +/- 0.28 mm/yr based on monthly mean sea level data from 1919 to 2006 which is equivalent to a change of 1.05 feet in 100 years. http://tidesandcurrents.noaa.gov/sltrends/sltrends_station.shtml?stnid=8557380
Mean Sea Level Trend8443970 Boston, Massachusetts The mean sea level trend is 2.63 millimeters/year with a 95% confidenceinterval of +/- 0.18 mm/yr based on monthly mean sea level data from 1921 to 2006 which is equivalent to a change of 0.86 feet in 100 years http://tidesandcurrents.noaa.gov/sltrends/sltrends_station.shtml?stnid=8443970
Mean Sea Level Trend8418150 Portland, Maine The mean sea level trend is 1.82 millimeters/year with a 95% confidenceinterval of +/- 0.17 mm/yr based on monthly mean sea level data from 1912 to 2006 which is equivalent to a change of 0.60 feet in 100 years. http://tidesandcurrents.noaa.gov/sltrends/sltrends_station.shtml?stnid=8418150
Summary: Future Conditions • Different rates of SLR versus…. • Marsh capital • Sediment supply • Growth rate (increased CO2 increased Growth rate)
Effects of Previous Management Efforts • Ditch plugging • Ditch filling • OMWM/closed systems
Groundwater Results Moody Normal Transect Distance (m) a b,c Depth to groundwater (cm) d b b,c Open Ditch b,c b,c,d c,d Plugged Ditch e e
Granite Point 10 Moody 10 Parker River A 15 Parker River B2 6 Westbrook 16 Hammonasset State Park 24+ Peat Study Site Locations(Age of plugs)
Soil Bulk Density 2009 Significant Treatment Effects p<0.01 -0.001 **