Download
1 / 143
1.43k likes | 1.55k Views
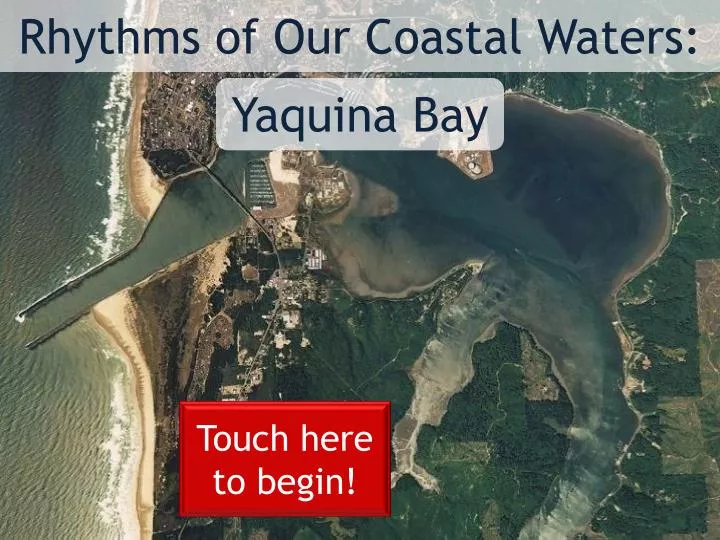
Rhythms of Our Coastal Waters:. Yaquina Bay. Touch here to begin!. Introduction. Welcome! Yaquina Bay, the estuary just outside, is an interesting, complex, and ever changing habitat. . What is an estuary?.

E N D
Rhythms of Our Coastal Waters: Yaquina Bay Touch here to begin!
Introduction Welcome! Yaquina Bay, the estuary just outside, is an interesting, complex, and ever changing habitat. What is an estuary? Researchers are currently collecting data about the water in the Bay using an instrument named LOBO. What is LOBO? My friends and I live in the Bay, and we are excited to explain this data to you and show you what a fascinating place the Bay is! Touch here to continue
Introduction As a team, my friends and I will walk you through 5 different levels so that you can help us tell the story of Yaquina Bay. Feel free to navigate through levels as you feel comfortable. The levels become more difficult as you progress up the food chain from Level 1 to Level 5. Start here to look at Yaquina Bay’s current salinity. Are you unsure of how to understand line graphs? I would start here. Level 3: Learn how to interpret real-time salinity graphs Level 1: Check out how graphs are built using salinity data Level 4: Challenge your abilities with a rainfall and salinity match-up Level 2: Explore the links between rainfall, river flow, and salinity Level 5: Test your data sleuthing skills to explore Yaquina Bay’s story More info
More info page Build a graph (Level 1) Are you confused by a word or interested to learn more? You have come to the right place! Touch a button below to explore that topic. Interpret Graphs (Level 2) Read LOBO Graphs (Level 3) What is salinity? What is an estuary? What is LOBO? LOBO Data Match-up (Level 4) What is PSU? How do tides affect an estuary? About the exhibit Test Your LOBO Abilities (Level 5) More info
How To Build A Graph Build A Graph (Level 1) Howdy! I’m Mega, a crab plankton! I am going to be walking you through how salinity changes in the Bay as well as how to read salinity graphs. Interpret Graphs (Level 2) Use the buttons on the left to navigate to a different level at any time. Read LOBO Graphs (Level 3) LOBO Data Match-up (Level 4) Remember you will always have the home and back button if you get lost. Test Your LOBO Abilities (Level 5) Touch here to start! More info
How To Build A Graph Build A Graph (Level 1) Interpret Graphs (Level 2) Read LOBO Graphs (Level 3) 0 psu 10 psu 20 psu 30 psu 40 psu LOBO Data Match-up (Level 4) Touch in the box above where you think the average Pacific Ocean salinity is located along the line. This is the range of how much salt can be in water. If fresh, bottled water has a salinity of 0 psu, how salty do you think the OCEAN is? Test Your LOBO Abilities (Level 5) What is PSU? More info
How To Build A Graph Build A Graph (Level 1) O Pacific Ocean Entire Year 35 psu Interpret Graphs (Level 2) 0 psu 10 psu 20 psu 30 psu 40 psu Read LOBO Graphs (Level 3) O The average salinity of the Pacific Ocean is 35 psu! LOBO Data Match-up (Level 4) Great! Test Your LOBO Abilities (Level 5) More info Touch here to continue
How To Build A Graph Build A Graph (Level 1) O Pacific Ocean Entire Year 35 psu Interpret Graphs (Level 2) 0 psu 10 psu 20 psu 30 psu 40 psu Read LOBO Graphs (Level 3) O LOBO Data Match-up (Level 4) The average salinity of the Pacific Ocean is actually 35 psu! Not quite! Test Your LOBO Abilities (Level 5) Touch here to continue More info
How To Build A Graph Build A Graph (Level 1) O Pacific Ocean Entire Year 35 psu Interpret Graphs (Level 2) 0 psu 10 psu 20 psu 30 psu 40 psu Read LOBO Graphs (Level 3) O LOBO Data Match-up (Level 4) Touch in the box above where you think the average Yaquina Bay salinity is located along the line. If the salinity of the ocean is 35 psu, and Yaquina Bay is an estuary where the ocean meets fresh, river water, what do you think the average YAQUINA BAY salinity is? Test Your LOBO Abilities (Level 5) More info
How To Build A Graph Build A Graph (Level 1) B O Pacific Ocean Entire Year 35 psu Yaquina Bay Entire Year 28 psu Interpret Graphs (Level 2) 0 psu 10 psu 20 psu 30 psu 40 psu Read LOBO Graphs (Level 3) B O LOBO Data Match-up (Level 4) The average salinity of Yaquina Bay is 28 psu! Great job! Test Your LOBO Abilities (Level 5) Touch here to continue More info
How To Build A Graph Build A Graph (Level 1) B O Pacific Ocean Entire Year 35 psu Yaquina Bay Entire Year 28 psu Interpret Graphs (Level 2) 0 psu 10 psu 20 psu 30 psu 40 psu Read LOBO Graphs (Level 3) B O The average salinity of Yaquina Bay is actually 28 psu! LOBO Data Match-up (Level 4) Not quite! Test Your LOBO Abilities (Level 5) Touch here to continue More info
How To Build A Graph Build A Graph (Level 1) B O Pacific Ocean Entire Year 35 psu Yaquina Bay Entire Year 28 psu Interpret Graphs (Level 2) 0 psu 10 psu 20 psu 30 psu 40 psu Read LOBO Graphs (Level 3) B O LOBO Data Match-up (Level 4) Touch in the box above where you think the average winter Yaquina Bay salinity is located along the line. Because of our seasonal weather patterns here on the coast of Oregon, the salinity in the Bay does not stay constant through out the year. Do you know what the average salinity is in YAQUINA BAY during the rainy winter? Test Your LOBO Abilities (Level 5) More info
How To Build A Graph Build A Graph (Level 1) W B O Yaquina Bay Winter 26 psu Pacific Ocean Entire Year 35 psu Yaquina Bay Entire Year 28 psu Interpret Graphs (Level 2) 0 psu 10 psu 20 psu 30 psu 40 psu Read LOBO Graphs (Level 3) W B O The average salinity of Yaquina Bay during the winter is around 26 psu! LOBO Data Match-up (Level 4) Great job! Test Your LOBO Abilities (Level 5) Touch here to continue More info
How To Build A Graph Build A Graph (Level 1) W B O Yaquina Bay Winter 26 psu Pacific Ocean Entire Year 35 psu Yaquina Bay Entire Year 28 psu Interpret Graphs (Level 2) 0 psu 10 psu 20 psu 30 psu 40 psu Read LOBO Graphs (Level 3) W B O The average salinity of Yaquina Bay during the winter is around 26 psu! LOBO Data Match-up (Level 4) Not quite! Test Your LOBO Abilities (Level 5) Touch here to continue More info
How To Build A Graph Build A Graph (Level 1) W B O Yaquina Bay Winter 26 psu Pacific Ocean Entire Year 35 psu Yaquina Bay Entire Year 28 psu Interpret Graphs (Level 2) 0 psu 10 psu 20 psu 30 psu 40 psu Read LOBO Graphs (Level 3) W B O LOBO Data Match-up (Level 4) Touch in the box above where you think the average summer Yaquina Bay salinity is located along the line. If the winter salinity in Yaquina Bay is less than the overall average, then where does the warm summer salinity fall on the line? Test Your LOBO Abilities (Level 5) More info
How To Build A Graph Build A Graph (Level 1) W B S O Yaquina Bay Winter 26 psu Yaquina Bay Summer 32 psu Pacific Ocean Entire Year 35 psu Yaquina Bay Entire Year 28 psu Interpret Graphs (Level 2) 0 psu 10 psu 20 psu 30 psu 40 psu Read LOBO Graphs (Level 3) W B S O The average salinity of Yaquina Bay during the summer is around 32 psu! LOBO Data Match-up (Level 4) Great job! Test Your LOBO Abilities (Level 5) Touch here to continue More info
How To Build A Graph Build A Graph (Level 1) W B S O Yaquina Bay Winter 26 psu Yaquina Bay Summer 32 psu Pacific Ocean Entire Year 35 psu Yaquina Bay Entire Year 28 psu Interpret Graphs (Level 2) 0 psu 10 psu 20 psu 30 psu 40 psu Read LOBO Graphs (Level 3) W B S O The average salinity of Yaquina Bay during the summer is around 32 psu! LOBO Data Match-up (Level 4) Not quite! Test Your LOBO Abilities (Level 5) Touch here to continue More info
How To Build A Graph Build A Graph (Level 1) W B S O Yaquina Bay Winter 26 psu Yaquina Bay Summer 32 psu Pacific Ocean Entire Year 35 psu Yaquina Bay Entire Year 28 psu Interpret Graphs (Level 2) 0 psu 10 psu 20 psu 30 psu 40 psu Read LOBO Graphs (Level 3) W B S O You can see that the ocean has a higher salinity, or more salt, than Yaquina Bay! Lets look more closely at how the Bay’s salinity changes during the year. LOBO Data Match-up (Level 4) Test Your LOBO Abilities (Level 5) To do this, we must first flip the line graph on its head. Touch here to continue More info
How To Build A Graph Build A Graph (Level 1) W B S O O Yaquina Bay Winter 26 psu Yaquina Bay Summer 32 psu Pacific Ocean Entire Year 35 psu S Yaquina Bay Entire Year 28 psu Interpret Graphs (Level 2) B W 0 psu 10 psu 20 psu 30 psu 40 psu Read LOBO Graphs (Level 3) W B S O 10 psu 0 psu 20 psu 40 psu 30 psu LOBO Data Match-up (Level 4) Now we have to add a timeline to our graph. By adding the months, we can look at changes over one year. Test Your LOBO Abilities (Level 5) Touch here to add the months More info
How To Build A Graph Build A Graph (Level 1) O S Interpret Graphs (Level 2) B W 10 psu 20 psu 40 psu 30 psu 0 psu Read LOBO Graphs (Level 3) 10 psu 0 psu 20 psu 40 psu 30 psu LOBO Data Match-up (Level 4) July May June March April January August February October December September November Test Your LOBO Abilities (Level 5) Now we have the salinity range and time defined, we need the data. Touch here to see Yaquina Bay’s average salinity for each month More info
How To Build A Graph Build A Graph (Level 1) Interpret Graphs (Level 2) 10 psu 20 psu 40 psu 30 psu 0 psu Read LOBO Graphs (Level 3) 22.9 32.1 32.5 32.8 26.7 25.0 27.5 28.1 31.3 33.1 33.3 24.6 LOBO Data Match-up (Level 4) July May June March April January August February October December September November Test Your LOBO Abilities (Level 5) We can make two different types of graphs with this data. The first is a bar graph. Touch here to add the bars for each month More info
How To Build A Graph Build A Graph (Level 1) Interpret Graphs (Level 2) 10 psu 20 psu 40 psu 30 psu 0 psu Read LOBO Graphs (Level 3) 22.9 32.1 32.5 32.8 26.7 25.0 27.5 28.1 31.3 33.1 33.3 24.6 LOBO Data Match-up (Level 4) July May June March April January August February October December September November Test Your LOBO Abilities (Level 5) You can see that for a bar graph, the largest numbers during the summer have the highest bars. Touch here to make the second type of graph, a line graph More info
How To Build A Graph Build A Graph (Level 1) 33.1 33.3 32.8 32.5 32.1 31.3 28.1 27.5 Interpret Graphs (Level 2) 26.7 25.0 24.6 22.9 10 psu 20 psu 40 psu 30 psu 0 psu Read LOBO Graphs (Level 3) LOBO Data Match-up (Level 4) July May June March April January August February October December September November Test Your LOBO Abilities (Level 5) The first step is to replace the bars with dots, or data points. Now that we have our data points, we have to connect the dots. Touch here to create the connecting lines More info
How To Build A Graph Build A Graph (Level 1) 33.1 33.3 32.8 32.5 32.1 31.3 28.1 27.5 Interpret Graphs (Level 2) 26.7 25.0 24.6 22.9 10 psu 20 psu 40 psu 30 psu 0 psu Read LOBO Graphs (Level 3) LOBO Data Match-up (Level 4) July May June March April January August February October December September November Test Your LOBO Abilities (Level 5) You can see that just like in the bar graph, the highest salinity is in the summer, where the data points are the highest. That’s the end of this section! Touch here to move on to Level 2! More info
How To Interpret Graphs Build A Graph (Level 1) Hiya! I am Myt the Mussel and I will help you use graphs and understand what they are telling us. Interpret Graphs (Level 2) In this section, there are a series of multiple choice questions: 4 about the rainfall and river flow relationship, and 4 about the rainfall and salinity relationship. Read LOBO Graphs (Level 3) Remember that you have the home, back, and help button if you get lost. LOBO Data Match-up (Level 4) Test Your LOBO Abilities (Level 5) Touch here to interpret rainfall, river flow, and salinity graphs! More info
How To Interpret Graphs Build A Graph (Level 1) Interpret Graphs (Level 2) Read LOBO Graphs (Level 3) LOBO Data Match-up (Level 4) Here are average rainfall and river flow, or discharge, graphs. Do you think that they are related? river flow, or discharge rainfall Test Your LOBO Abilities (Level 5) The best way to find out is to merge the two graphs into one so that we can compare them more easily. Touch here to continue More info
How To Interpret Graphs Build A Graph (Level 1) Interpret Graphs (Level 2) This graph has the same bottom axes as the other two, but now we have two vertical axes instead of one. Read LOBO Graphs (Level 3) LOBO Data Match-up (Level 4) In case you are confused, blue is for rainfall and red is for river discharge. Test Your LOBO Abilities (Level 5) Do you see any patterns due to seasons in this graph? Yes No More info
How To Interpret Graphs Build A Graph (Level 1) Interpret Graphs (Level 2) Great job on noticing a pattern in this graph! Read LOBO Graphs (Level 3) Which of the following statements is true about this graph? LOBO Data Match-up (Level 4) In September there is high rainfall and high discharge In January there is high rainfall and low discharge In July there is low rainfall and low discharge In March there is low rainfall and high discharge Test Your LOBO Abilities (Level 5) More info
How To Interpret Graphs Build A Graph (Level 1) Interpret Graphs (Level 2) Not quite Be sure to look at every month to see if the rainfall and discharge are high or low compared to other months. Read LOBO Graphs (Level 3) LOBO Data Match-up (Level 4) In September there is high rainfall and high discharge In January there is high rainfall and low discharge In July there is low rainfall and low discharge In March there is low rainfall and high discharge Test Your LOBO Abilities (Level 5) More info
How To Interpret Graphs Build A Graph (Level 1) Interpret Graphs (Level 2) High Not quite Check out the lines I added. They show you that rainfall and discharge follow each other. Read LOBO Graphs (Level 3) Low LOBO Data Match-up (Level 4) In September there is high rainfall and high discharge In January there is high rainfall and low discharge In July there is low rainfall and low discharge In March there is low rainfall and high discharge Test Your LOBO Abilities (Level 5) More info
How To Interpret Graphs Build A Graph (Level 1) Interpret Graphs (Level 2) Not quite Let’s review how to read this graph. Read LOBO Graphs (Level 3) LOBO Data Match-up (Level 4) Focusing just on the blue rainfall line, what can you say about the amount of rainfall in winter compared to the rest of the year? How about in summer, are these the same or different from winter? Test Your LOBO Abilities (Level 5) Now do the same for the red discharge line. Do you think that the rainfall and discharge lines follow, mirror image, or have no relationship with each other? Touch here to continue More info
How To Interpret Graphs Build A Graph (Level 1) Interpret Graphs (Level 2) Let’s take a closer look at this graph. Read LOBO Graphs (Level 3) LOBO Data Match-up (Level 4) Focusing just on the blue rainfall line, what can you say about the amount of rainfall in winter compared to the rest of the year? How about in summer, are these the same or different from winter? Test Your LOBO Abilities (Level 5) Now do the same for the red discharge line. Do you think that the rainfall and discharge lines follow, mirror image, or have no relationship with each other? Touch here to continue More info
How To Interpret Graphs Build A Graph (Level 1) Interpret Graphs (Level 2) Read LOBO Graphs (Level 3) LOBO Data Match-up (Level 4) Test Your LOBO Abilities (Level 5) The major pattern to focus on is that rainfall and discharge follow each other and both have a dip, or less amount measured, in the summer months. When there is not much rain, the river doesn’t have as much water running in it. Touch here to continue More info
How To Interpret Graphs Build A Graph (Level 1) Interpret Graphs (Level 2) Great! Rainfall affects the amount of river discharge. When there is more rain, there is more water flowing through the river. Read LOBO Graphs (Level 3) LOBO Data Match-up (Level 4) In July there is low rainfall and low discharge Test Your LOBO Abilities (Level 5) Touch here to continue More info
How To Interpret Graphs Build A Graph (Level 1) Interpret Graphs (Level 2) These data can also help us understand the seasons in the estuary. Read LOBO Graphs (Level 3) Based on this graph, I can tell the difference between 2 seasons. LOBO Data Match-up (Level 4) Summer: March - July Winter: December - February Test Your LOBO Abilities (Level 5) Which do you think describes one of these seasons the best? Summer: May - October Winter: August - January More info
How To Interpret Graphs Build A Graph (Level 1) Interpret Graphs (Level 2) Not quite Think about how much rainfall and discharge occur in Newport during winter and summer. Read LOBO Graphs (Level 3) LOBO Data Match-up (Level 4) Summer: March - July Winter: December - February Which months incorporate an entire high or low level of rainfall and discharge? Test Your LOBO Abilities (Level 5) Summer: May - October Winter: August - January More info
How To Interpret Graphs Build A Graph (Level 1) Interpret Graphs (Level 2) Not quite I added a line that helped me. Does it help you? Read LOBO Graphs (Level 3) LOBO Data Match-up (Level 4) The months with both rain and discharge levels above the line should be grouped together, and same for the months under the line. Summer: March - July Winter: December - February Test Your LOBO Abilities (Level 5) Summer: May - October Winter: August - January More info
How To Interpret Graphs Build A Graph (Level 1) Interpret Graphs (Level 2) Not quite Do these labels help you? Read LOBO Graphs (Level 3) Winter Summer LOBO Data Match-up (Level 4) The months with both rain and discharge levels above the line are during the winter, and the months under the line are summer. Summer: March - July Winter: December - February Test Your LOBO Abilities (Level 5) Summer: May - October Winter: August - January More info
How To Interpret Graphs Build A Graph (Level 1) Interpret Graphs (Level 2) Read LOBO Graphs (Level 3) Winter Winter Summer LOBO Data Match-up (Level 4) Not quite Using this graph, we can tell that Summer is May- October and Winter is November- April. Test Your LOBO Abilities (Level 5) Summer: May - October Touch here to continue More info
How To Interpret Graphs Build A Graph (Level 1) Interpret Graphs (Level 2) Read LOBO Graphs (Level 3) Winter Winter Summer LOBO Data Match-up (Level 4) Excellent! Using this graph, we can tell that Summer is May- October and Winter is November- April. Test Your LOBO Abilities (Level 5) Summer: May - October Touch here to continue More info
How To Interpret Graphs Build A Graph (Level 1) Interpret Graphs (Level 2) Here are two new graphs of rainfall during an entire month. Read LOBO Graphs (Level 3) LOBO Data Match-up (Level 4) Touch on the graph that shows a winter month. Test Your LOBO Abilities (Level 5) More info
How To Interpret Graphs Build A Graph (Level 1) Interpret Graphs (Level 2) Not quite Can you think of the amount of rain that falls in winter? Read LOBO Graphs (Level 3) Is it high or low? Which of these graphs show that amount? LOBO Data Match-up (Level 4) Test Your LOBO Abilities (Level 5) Touch on the graph that shows a winter month. More info
How To Interpret Graphs Build A Graph (Level 1) Interpret Graphs (Level 2) Not quite Month A is actually the winter month. Notice how more rain fell on more of the days in Month A than in Month B. Read LOBO Graphs (Level 3) LOBO Data Match-up (Level 4) Test Your LOBO Abilities (Level 5) Touch here to continue More info
How To Interpret Graphs Build A Graph (Level 1) Interpret Graphs (Level 2) Excellent! Month A is the winter month. Notice how more rain fell on more of the days in Month A than in Month B. Read LOBO Graphs (Level 3) LOBO Data Match-up (Level 4) Test Your LOBO Abilities (Level 5) Touch here to continue More info
How To Interpret Graphs Build A Graph (Level 1) Interpret Graphs (Level 2) Does all that fresh rain and river discharge water affect the salinity, or amount of salt, in the Bay water? Read LOBO Graphs (Level 3) Since the pattern of rainfall and discharge are so similar, I am going to use just rainfall to represent both of these. LOBO Data Match-up (Level 4) Let’s merge these two graphs and see what they tell us about my home in the Bay. Test Your LOBO Abilities (Level 5) Touch here to continue More info
How To Interpret Graphs Build A Graph (Level 1) Interpret Graphs (Level 2) Compare the lines of this graph to the rainfall and discharge graph. Read LOBO Graphs (Level 3) LOBO Data Match-up (Level 4) Do you think the rainfall and salinity lines in this graph fit in the same summer and winter seasons that we decided on before? Test Your LOBO Abilities (Level 5) Yes No What is PSU? More info
How To Interpret Graphs Build A Graph (Level 1) High High Interpret Graphs (Level 2) Low Remember that we determined seasons based on high and low rainfall. Read LOBO Graphs (Level 3) Low LOBO Data Match-up (Level 4) Well, we can do the same thing with salinity. Test Your LOBO Abilities (Level 5) The rainfall season lines are added to see if the majority of the high or low salinity fits in these lines. Touch here to continue More info
How To Interpret Graphs Build A Graph (Level 1) Interpret Graphs (Level 2) Which of these statements describes the relationship between the salinity pattern and the rainfall pattern? Read LOBO Graphs (Level 3) LOBO Data Match-up (Level 4) Test Your LOBO Abilities (Level 5) The patterns are identical The patterns are mirror images or opposites The patterns have no relationship More info
How To Interpret Graphs Build A Graph (Level 1) Interpret Graphs (Level 2) Not quite Check out the time of year when rainfall is lowest. What is salinity doing? Read LOBO Graphs (Level 3) LOBO Data Match-up (Level 4) How about when rainfall is highest? Test Your LOBO Abilities (Level 5) The patterns are identical The patterns are mirror images or opposites The patterns have no relationship More info
How To Interpret Graphs Build A Graph (Level 1) Interpret Graphs (Level 2) Not quite The patterns are mirror images or opposites because salinity is highest when there is the least amount of rain, and vice versa. Read LOBO Graphs (Level 3) LOBO Data Match-up (Level 4) Test Your LOBO Abilities (Level 5) The patterns are mirror images or opposites Click here to continue More info