1 / 1

Sales Forecasting Chart

Get this template plus 350 other premium business tools & templates at www.demandmetric.com

Download Presentation

Sales Forecasting Chart

An Image/Link below is provided (as is) to download presentation Download Policy: Content on the Website is provided to you AS IS for your information and personal use and may not be sold / licensed / shared on other websites without getting consent from its author. Content is provided to you AS IS for your information and personal use only. Download presentation by click this link. While downloading, if for some reason you are not able to download a presentation, the publisher may have deleted the file from their server. During download, if you can't get a presentation, the file might be deleted by the publisher.

E N D

Presentation Transcript


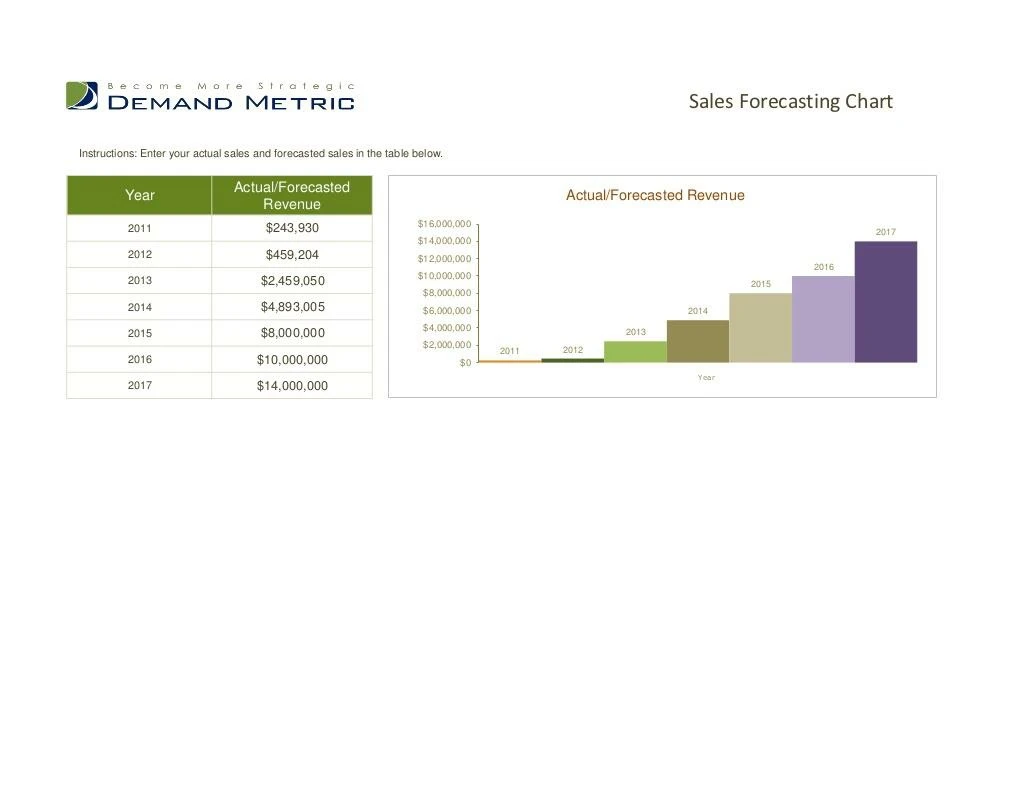
  1. Sales Forecasting Chart Sales Forecasting ChartInstructions: Enter your actual sales and forecasted sales in the table below. Actual/Forecasted Year Actual/Forecasted Revenue Revenue $16,000,000 2011 $243,930 2017 $14,000,000 2012 $459,204 $12,000,000 2016 $10,000,000 2013 $2,459,050 2015 $8,000,000 2014 $4,893,005 $6,000,000 2014 $4,000,000 2015 $8,000,000 2013 $2,000,000 2012 2011 2016 $10,000,000 $0 Year 2017 $14,000,000

More Related