Download

1 / 36
650 likes | 1.37k Views
7. Market Potential And Sales Forecasting. Forecasts vs. Potential. Major Uses of Potential Estimates. To make entry / exit decisions To make resource level decisions To make location and other resource allocation decisions To set objectives and evaluate performance

E N D
7 Market Potential And Sales Forecasting
Major Uses of Potential Estimates • To make entry / exit decisions • To make resource level decisions • To make location and other resource allocation decisions • To set objectives and evaluate performance • As an input to forecasts
Deriving Potential Estimates Data Secondary data Calculations Result Past sales data Model/Statistical method Potential estimate Surveys/ Primary data Judgment Secondary sources
Useful Sources for Potential Estimates • Government Sources • Trade Associations • Private Companies • Financial and Industry Analysts • Popular Press • The Internet
New or Growing Product Potential • Relative Advantage • Is the new product superior in key benefits? • To what degree? • Compatibility • What level of change is required to understand and use a new product? • For customers? Intermediaries? The company? • Risk • How great is the risk involved? • What is the probability someone will buy a new product?
Methods of Estimating Market and Sales Potential • Analysis-Based Estimates • Determine the potential buyers or users of the product • Determine how many are in each potential group of buyers defined by step 1 • Estimate the purchasing or usage rate
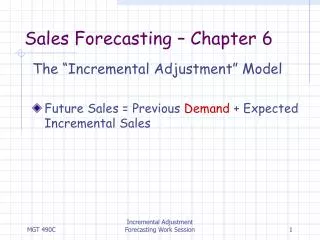
How Are Sales Forecasts Used? • To answer “what if” questions • To help set budgets • To provide a basis for a monitoring system • To aid in production planning • By financial analysts to value a company
Judgment-based Forecasting Methods • Naïve extrapolation • Sales force composite • Jury of expert opinion • Delphi method
Customer-Based Forecasting Methods • Market testing • Situations in which potential customers are asked to respond to a product concept • Mall Intercept Surveys • Focus Groups • Market surveys • A form of primary market research in which potential customers are asked to give some indication of their likelihood of purchasing a product
Time-Series Forecasting Methods • Moving Averages • Exponential Smoothing • Regression Analysis
Time-Series Extrapolation Sales s = 85.4 + 9.88 (time) • 174.5 • • • • • • • • • 1 • 12 • • • • • Time
Model-Based Methods • Regression analysis • Leading indicators • Econometric models
Use of New Product Forecasting Techniques by All Responding Firms
Developing Regression Models • Plot Sales Over Time • Consider the Variables that Are Relevant to Predicting Sales • Collect Data • Analyze the Data • Examine the correlations among the independent variables • Run the regression • Determine the significant predictors
Cereal Data Correlation Matrix* The numbers in each cell are presented as: correlation, (sample size), significant level
Regression Results: Cereal Data* Numbers in ( ) are standard errors
Graphical Eyeball Forecasting Sales ƍ Range • • Forecast • • • • • • • • Time
Input Data Time Sales • 100 • 110 • 105 • 130 • 140 • 120 • 160 • 175 Time-Series Regression Example Prediction Ŝ Computer/ Calculator 94.3 105.2 115.0 124.9 134.8 144.7 154.6 164.4 Sales=85.4+9.88 (time)
Trial over Time for a New Product Number who try a new product for first time Time