Download

1 / 17
180 likes | 389 Views
Sales Forecasting. “All planning begins with a forecast.”. Sales Forecasting at IDES Mfg. IDES manufactures a desktop computer, the “Eman” . The computer is made at the IDES plant in Flagstaff.

E N D
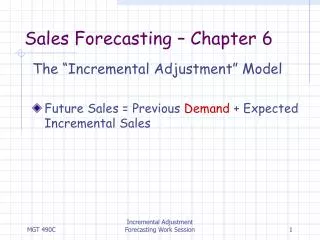
Sales Forecasting “All planning begins with a forecast.”
Sales Forecasting at IDES Mfg. • IDES manufactures a desktop computer, the “Eman”. The computer is made at the IDES plant in Flagstaff. • It is the beginning of January 2002 and different groups of IDES management is engaged in planning for the next month, the next year, and the next five years. • Since all planning begins with a forecast, IDES needs to get busy creating forecasts.
Planning Activities at IDES • IDES present computer manufacturing capacity: • Per Qtr. Regular Time = 312,000; O/T = 374,400 • Per Year Regular time =1,248,000; O/T = 1,497,600 • For the 1st quarter of 2002, IDES needs to make plans to schedule production. This requires determining the labor and materials needs to meet sales demand. • For the entire year 2002, IDES needs to determine if any additions to capacity will be required to meet sales demand. • IDES needs to know if the present Flagstaff plant will be able to produce enough “Eman” computers to meet sales demand over the next five years.
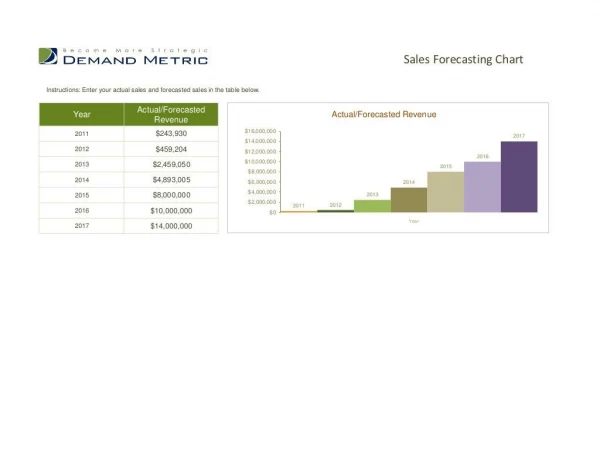
Annual Sales Year Unit Sales 1998 420,000 1999 622,000 2000 901,000 2001 1,321,000 Quarterly Sales (000) 2000 2001 Qtr. 1 186 250 Qtr. 2 222 314 Qtr. 3 216 310 Qtr. 4 277 447 Total 901 1321 IDES Historical Sales Data:
The time frame for the sales forecast will determine the appropriate forecasting “technique”. • In many situations, short-run sales forecasts are made using the technique, “same period last ____”. • Other short-run sales forecasting techniques are “moving average”, “weighted moving average”, and “exponential smoothing”. • “Trend Projection” can be used to make both short-run and intermediate-run sales forecasts. This techniques uses the statistical tool known as regression analysis. • In “Trend Projection”, the assumption is made that sales depend on the passage of time. Sales follow a “trend” (increase, decrease, remain the same) as time passes.
Creating a short & intermediate “Trend Projection” Forecast using Simple Linear Regression • Arrange the Sales Data in SLR Format: Year Qtr (x) Sales (y) (x)2 xy 2000 1 1 186 1 186 2 2 222 4 444 3 3 216 9 648 4 4 277 16 1108 2001 1 5 250 25 1250 2 6 314 36 1884 3 7 310 49 2170 4 8 477 64 3816 Sum 36 2252 204 11506
Finding the “trend” line (y = a + bx) for the “intermediate-run” sales forecast: • Use the formulas on page 94 to calculate “b” (the slope) and “a” (the intercept) of the SLR “trend” line. b = 11506 – 8(4.5)(281.5) = 32.67 204 – 8(4.5)^2 a = 281.5 – 32.67(4.5) = 134.49
Calculate the 2002 Sales Forecast by Quarter: • Yt = a + bxt = 134.49 + 32.67(xt) • We used “x” values 1-8 to derive the above equation. • Substitute the next 4 values for “x” into the above equation and solve: Year-Quarter (xt) Unit Sales(000) (yt) 2002 - 1 9 428.52 - 2 10 461.19 - 3 11 493.86 - 4 12 526.53
Calculating a “Trend” Forecastusing Simple Linear Regression • Arrange the Annual Sales Data in SLR Format: Year (x) Sales (y) (x)2 xy 1998 1 420 1 420 1999 2 622 4 1244 2000 3 901 9 2703 2001 41321165284 Sum 10 3264 30 9651 x-bar = 2.5 y-bar = 816
Using SLR (trend projection) to create the “Long-Term” Sales Forecast: • Use the formulas on page 94 to calculate “b” (the slope) and “a” (the intercept) of the SLR “trend” line. b = 9651 – 4(2.5)(816) = 298.2 30 – 4(2.5)(2.5) a = 816 – 298.2(2.5) = 70.5
Calculate the 5-Year Sales Forecast • Yt = a + bxt = 70.5 + 298.2(xt) Substitute the next 5 values for “x” into the above equation and solve: Year (xt) Unit Sales (000) (yt) 2002 5 1561.5 2003 6 1859.7 2004 7 2157.9 2005 8 2456.1 2006 9 2754.3
What does the “Long-Term” Sales Forecasts tell us? Forecast Present Capacity Year SLR Reg Time O/T Shortage 2002 1562 1248 1498 64 2003 1860 1248 1498 362 2004 2158 1248 1498 660 2005 2456 1248 1498 958 • 2754 1248 1498 1256 • IDES Manufacturing will have to subcontract for 64,000 units during 2002 and begin to add capacity during 2002 to meet the expected demand during the next five years.
Another method for making the “Intermediate-Term” Sales Forecast: • Calculating a “Seasonally Adjusted Trend” Sales Forecast: • From the historical data, find the “Seasonal Index” (SI) for each quarter of the year. • Using the “trend line” calculate the sales for 2002 (entire year). • Multiply the appropriate SI by the sales forecast for the year to obtain the “Seasonally Adjusted” sales forecast for each quarter.
Seasonal Index = Ave for Qtr/Ave for Year 2000 2001 Total Ave. Seasonal Index Qtr. 1 186 250 436 218 0.1962 Qtr. 2 222 314 536 268 0.2421 Qtr. 3 216 310 526 263 0.2367 Qtr. 4 277 447 724 362 0.3258 Total 901 1321 Total sales for both years = 901+1321 = 2222 The average annual sales for the two years = 1111 To calculate the SI: Qtr.1 = (Ave Sales Qtr 1)/(Ave Annual Sales) =0.1962
Seasonally Adjusted Forecast for 2002 • Multiply the SI for each quarter by the forecast for the entire year: Qtr 1: (0.1962)(1562) = 306.46 Qtr 2: (0.2421)(1562) = 378.16 Qtr 3: (0.2367)(1562) = 369.73 Qtr 4: (0.3258)(1562) = 508.90
Forecast for Qtr 1 of 2001: • Use the forecast for Qtr 1 we just calculated. It incorporates both the trend (growth in this case) and the seasonal influences that are evident in the historical sales data. • Qtr 1 Forecast = 306.46
What does the Qtr 1 Forecast tell us? • Production capacity at regular time exceeds the sales forecast. • Regular time capacity = 312 • Forecast = 306.46 • IDES does not need to use overtime production or subcontracting to meet the needs for this quarter. • But Qtr 2 sales are expected to be 378.16 and this does exceed O/T capacity (364). • What should IDES do?