Download
1 / 38
400 likes | 568 Views
Advances in Reverberation Mapping. Line. Shai Kaspi Tel-Aviv University & Technion – Haifa Israel. Continuum. q. The Central Engine of AGNs” ” Xian, China ,16 October 2006. Outline.

E N D
Advances in Reverberation Mapping Line Shai Kaspi Tel-Aviv University & Technion – Haifa Israel Continuum q The Central Engine of AGNs”” Xian, China ,16 October 2006
Outline • Introduction to reverberation mapping- Current BLR Size – Luminosity Relation- Broadening the luminosity range- Mapping low luminosity AGNs- Mapping of high-luminosity quasars – preliminary results- Dust reverberation mapping- Summary and future prospects
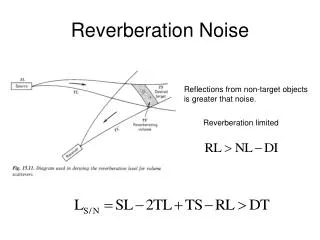
The entire BLR does not respond at the same time. A cloud at a distance R from the central source and angle q to the line of sight will appear to respond after a time: Line Continuum For a thick shell BLR the response to a continuum flash will be: q Line flux Time Reverberation Mapping • Continuum luminosity vary. • BLR respond to the variations (via photoionization).
Given the continuum light curve and the line light curve The “transfer function” is defined as: stores the information about the geometry and dynamics of the BLR. The transfer function can be retrieved using Fourier transform and convolution between the two light curves: ~ ~ Reverberation Mapping Blandford & McKee (1982) coined the term “reverberation mapping” and put it into mathematical formulation:
Two decades of data acquisition From Peterson (1988): ObjectRadius (ld) Akn 120 <30 NGC 4151 ~6 NGC 5548 ~30 3C 390.3 25-45 Early studies used relatively few, poorly spaces observations. Peterson & Gaskel 1986 • Monitoring campaigns during the 1990s: • Individual monitoring of Seyfert I AGNs (NGC5548, NGC4151, NGC7469 – Maoz et al. 1990 - and many more by the “AGN Watch” projects – Peterson 1999). • The Lovers of Active Galaxies (LAG) campaign (Robinson 1994). • The Ohio State monitoring program (Peterson et al. 1998). • The Wise Observatory and Steward Observatory 17 PG quasars monitoring program (Kaspi et al. 2000). Altogether ~35 objects with data sufficient for reverberation
AGN Spectrum Balmer lines PG0804+761 Ha Flux Hb Other lines Continuum Observed Wavelength
Light curves Continuum Flux Hb Line Flux Time Kaspi et al. 2000
~ ~ One Dimension Reverberation Mapping Due to the sparse data and inability to measure precisely subtle profile changes the search for the transfer function is collapsing to the “one dimension reverberation mapping”, which is just a cross correlation between the continuum and line light curves. The peak/centroid of the cross correlation is a measure to the size of the BLR – RBLR.
Using RBLR the central mass is: V is the BLR clouds velocity (either from FWHM or sLINE) f is a dimensionless factor that depends on the geometry and kinematics of the BLR. Central AGN Mass Finding the central (black hole) mass is one of the “holy grails” of reverberation mapping in the past decade…. (but the sample might be biased….) …..More in the next talk by Brad Peterson….
BLR Size – Luminosity Relation The BLR size – luminosity relation Both are fundamental measured quantities. Peterson et al. (2004) compiled all studies to date. 35 objects with Balmer (mainly Hb) lines time lag. Characteristic BLR size = Time Lag * speed of light. Luminosities in the Optical, UV, and X-rays. BLR size from averaging all Balmer lines time lags per object.
Linear Regression Uncertainties in both quantities And Intrinsic scatter in the relation Two regression methods: 2. BCES (Bivariate Correlated Errors and intrinsic Scatter) by Akritas & Bershady (1996). 1. FITEXY from Press et al. (1992) implemented by Tremaine et al. (2002). …and also outlier points…
Hb RBLR – Optical luminosity (5100 A) RBLR[lLl(5100 Å)] (0.69±0.05) Kaspi et al. 2005
HbRBLR – Optical luminosity (5100 A) RBLR[lLl(5100 Å)] (0.518±0.039) Bentz et al. 2006
Hb RBLR – UV luminosity (1450 A) RBLR[lLl(1450 Å)] (0.56±0.05) Kaspi et al. 2005
RBLR – X-ray luminosity (2-10 keV) RBLR[lLl(2-10 keV)] (0.70±0.14) Kaspi et al. 2005
RBLR – luminosity Relation, conclusions • Though small differences exist between the different regression methods the results are generally consistent. • Average slope is 0.67±0.05 for the optical continuum and broad Hβ luminosity, about 0.56±0.05 for the UV luminosity, and about 0.70±0.14 for the X-ray luminosity. • We find in these relations an intrinsic scatter of about 40% . • In some energy bands the slope is roughly like the naive theoretical prediction of 0.5. This prediction is naively based on the assumption that all AGNs have the same ionization parameter, BLR density, column density, and ionizing SED. 0.52±0.04 How can we determine a better relation? By taking more data
Broadening the Luminosity range - Hb Current studies span 4 orders of magnitude. There are 4 more orders of magnitude to be explored. Extrapolation does not necessarily give the real situation. We need to expand the luminosity range with reverberation mapping studies.
Broadening the Luminosity range – C IV Up to 2004 only four AGNs with C IV BLR size measurements
Broadening the Luminosity range – C IV Peterson et al. (2005) added NGC4395 four orders of magnitude in luminosity lower
Broadening the Luminosity range – C IV Still there are the high luminosity quasars at three orders of magnitude higher
Higher luminosities Quasar monitoring Photometrically monitoring 11 quasars for the past decade. 7 of which are spectroscopically monitored for the past 5 years. 2.1 < z < 3.2 1045.6 < L(5100 Å) < 1047 erg/s Photometric observation at the 1m Wise Observatory. Spectroscopic observation at 9m Hobby-Eberly Telescope (HET) and at the Wise Observatory. Lines monitored are C IV and Ly using the method of a comparison star simultaneously with the quasar in the slit. … Some preliminary results… (Kaspi et al., ApJ, Submitted)
SBS 1116+603 L(5100 Å) = 1.4×1046 erg/s z = 2.628 R=0.34 B=0.44
SBS 1116+603 : C IV – Continuum CCF No measurable time lag is found
S5 0836+71 L(5100 Å) = 1.1×1046 erg/s z = 2.172 R=0.34 B=0.44
Rest frame time lag: 188+27 days -37 S5 0836+71: C IV – Continuum CCF
Broadening the Luminosity range – C IV A preliminary result suggests a correlation between the C IV size and the luminosity
S5 0836+71: M . Mass – Luminosity Relation Peterson et al. (2005)
Kollatschny (2003) produced 2D transfer function for Mrk110: • Outer line wing respond before the inner line profile • Stratification of the ionization structure in the BLR ~ ~ Two Dimension Reverberation Mapping Transfer function simulation assuming BLR geometry and dynamics (Welsh & Horne 1991).
Dust Reverberation Mapping – Size of the AGN “Torus” (the dusty region) – Suganuma et al. (2006) – Using IR band and Optical monitoring: ObjectTime Lag (days) NGC 3227 NGC 4051 NGC 5548 NGC 7469 • Measure of the distance of Dust from the BH. • Tightly correlate with Luminosity. • Weakly correlate with Mass. Dust Reverberation Mapping
Summary of Reverberation Mapping • Size of the BLR ; BLR size scales with Luminosity. • Radial ionization stratification. • BLR clouds motion are virial and primarily orbital. • Mass of the Black Hole. • Dust reverberation mapping to map the dusty region. • Geometry and Kinematics of the BLR (?) - Finding the transfer function and deciphering the geometry and dynamics of the BLR still wait for high-spectral resolution, high S/N monitoring campaigns. - Reverberation mapping of the broad Iron 6.4 keV emission line to map the accretion disk (Reynolds 1999).
Future prospects • In the 1042 to 1046 erg/s luminosity range a firm relation exist between the BLR size and luminosity. Slope ranging from 0.5 to 0.7. • Expanding the luminosity range is important and first steps are being taken: • - Low luminosity Seyferts and LINERS to cover the luminosity range of 1040 to 1042 erg/sec. • - High luminosity quasars – preliminary results are encouraging. • Better measurement of the AGN luminosity. • Dust reverberation mapping. • Better time coverage and S/N spectra are needed for 2D TF. • Fe ka line reverberation in the X-ray.
Cross Correlation Methods • ICCF – Interpolated Cross Correlation Function – interpolating one light curve to the observation of the other and vice versa, then using the average CCF (Gaskell & Sparke 1986; White & Peterson 1994). • DCF – Discrete Correlation Function – binning the actual time delay between points of the light curve (Edelson & Krolik 1988). • ZDCF – z-transform Discrete Correlation Function – doing the DCF in a z-transformed space to get a better handle of errors (Alexander 1997). Uncertainty of the peak/centroid of the CCF (the time lag) is done using FR/RSS (Flux Randomization / Random Subset Selection) of Peterson et al. (1998)
Continuum light curves Z log L R B 2.628 46.14 0.34 0.44 3.177 46.88 0.16 0.22 2.172 46.05 0.34 0.44 2.824 46.62 0.25 0.27 3.200 46.96 0.14 0.19 2.722 47.04 0.16 0.20
S4 0636+68 L(5100 Å) = 7.6×1046 erg/s z = 3.117 R=0.16 B=0.22
HS 1700+6416 L(5100 Å) = 1047 erg/s z = 2.722 R=0.16 B=0.20
⇒Hb lag about: days Scaling C IV size to Hb size S5 0836+71: CIV lag: days NGC4395: CIV lag: min ⇒Hb lag about: min In two weeks, optical monitoring of NGC4395 spectroscopically from KPNO and photometrically from four observatories around the world cover 22 hours a day for four days.
Title Text