Download
1 / 17
180 likes | 636 Views
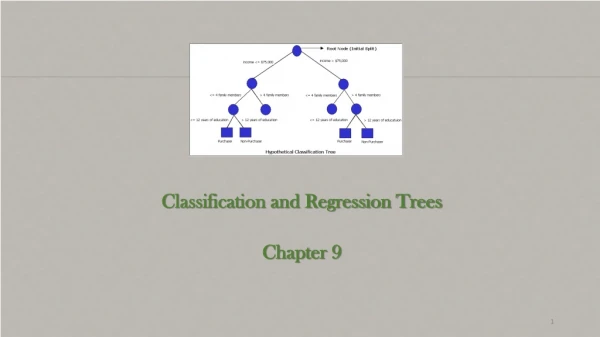
Classification and Regression Trees. JMP Partition Platform. In the News …. Why? What is it? How does it work? JMP Mechanics Evaluating model? Assessing usefulness? Understanding results Applying results. Analyze > Distribution. Data set > Riding Mowers. Begin with a 1-way analysis.

E N D
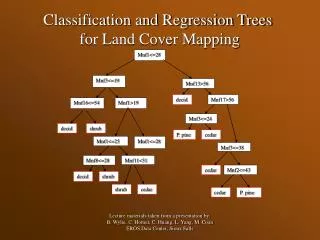
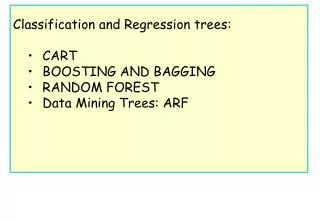
Classification and Regression Trees JMP Partition Platform Classification Trees
In the News … • Why? • What is it? • How does it work? • JMP Mechanics • Evaluating model? • Assessing usefulness? • Understanding results • Applying results Classification Trees
Analyze > Distribution Data set > Riding Mowers Begin with a 1-way analysis. There is an equal distribution of values for the two levels of the response variable. Classification Trees
Why? • What is it? • How does it work? • JMP Mechanics • Evaluating model? • Assessing usefulness? • Understanding results • Applying results Exploring Predictors If we put this in Scatterplot Matrix we are looking for the variable to split to give us best homogeneity Classification Trees
Homogeneity It looks like at an Income of about 85 we would have a “pure” partition only having “owner” records for > 85. Classification Trees
Launch Partition • Why? • What is it? • How does it work? • JMP Mechanics • Evaluating model? • Assessing usefulness? • Understanding results • Applying results Analyze > Modeling > Partition Identify X and Y values in dialog box. Use defaults for everything else at this point. Classification Trees
Starting Point | To begin click on Split AICc = information criterion. Smaller number is better. Looks for a model with a good fit to the truth but with few parameters. G^2 = a likelihood ratio Chi-square; ratio is of expected to observed. Larger value the more likely there is a statistical difference. http://www.brianomeara.info/tutorials/aic Classification Trees
First Split Classification Trees
Splitting on the Income < 85.5 Leaf Classification Trees
Splitting at INCOME < 85.5 Classification Trees
Last Split at Lot Size < 20 Classification Trees
Result of Splitting on Lot Size < 20 Classification Trees
Split History Hot Spot > Split History We can see that the last split did not improve R-Square Classification Trees
Showing Fit Details • Why? • What is it? • How does it work? • JMP Mechanics • Evaluating model? • Assessing usefulness? • Understanding results • Applying results Focus on misclassification rate and maybe RMSE or Mean Abs Dev. For usefulness focus on the confusion matrix and think about the two types of misclassification. Classification Trees
Why? • What is it? • How does it work? • JMP Mechanics • Evaluating model? • Assessing usefulness? • Understanding results • Applying results Importance of Predictors Higher G^2 > increased importance in predicting outcome Classification Trees
Why? • What is it? • How does it work? • JMP Mechanics • Evaluating model? • Assessing usefulness? • Understanding results • Applying results Hot Spot > Save Columns > Save Prediction Formula Prob(Ownership ==owner) Classification Trees
Exercise Lost Sales Classification Trees