Download
1 / 71
710 likes | 844 Views
Implementing RtI 2 at the Secondary Level: The Critical Role of Leadership. Building Student Success: Response to Instruction Conference January, 2012 Judy Elliott, Ph.D. Former Chief Academic Officer Los Angeles Unified School District. Session Goals.

E N D
Implementing RtI2 at the Secondary Level:The Critical Role of Leadership Building Student Success: Response to Instruction Conference January, 2012 Judy Elliott, Ph.D. Former Chief Academic Officer Los Angeles Unified School District
Session Goals • Continue dialogue with the lens of Secondary • Importance of vertical articulation • Is Core all it should be? • Importance of courageous conversations about Beliefs
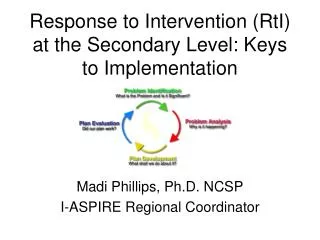
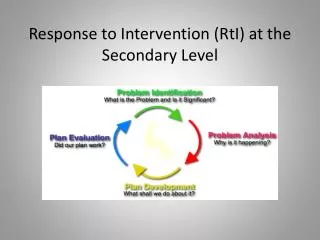
The Change Model RtI • RtI² Essential Components • Multi-tiered framework • Problem-solving process • Data-based decision-making • Academic engaged time • Professional development
Stages of Implementing Problem-Solving/RtI2 • Consensus • Belief is shared • Vision is agreed upon • Implementation requirements understood • Infrastructure Development • Problem-Solving Process • Data System • Policies/Procedures • Training/Technical Assistance • Tier I and II intervention systems • e.g., K-3 Academic Support Plan • Technology support • Decision-making criteria established • Implementation
School Consensus • School consensus is long-term and on-going • RtI² allows staff to have a stake in the design of what RtI² looks like at their school 5
Middle- and High-SchoolApplication of RtI2 • SAME critical components should be present K-12 • Implementation of the critical components will look different at the middle-and high-school levels. • The differences are influenced by the organization of the level, type and focus of curriculum, logistics of scheduling at the middle- and high-school levels.
Areas of “Same” and “Different” At the Secondary Level Same Different Consensus Monitor Skills and Content Types of data Schedule Development Integration of the Tiers Student Involvement Fidelity • Problem-Solving Process • School-Based Leadership Teams • Data Days to Evaluate “Health and Wellness” • Data Matrix • Multi-Tiered System • Fidelity
Some “Givens” • Middle- and High-School teams “inherit” the strengths and weaknesses (and Gaps) students bring to the level • Successful high school performance begins with kindergarten • Most successful high school “intervention” is to ensure that students enter with as much strength as possible • The best high-school “screening” tool is the compilation of data in K-8
Some “Givens” • Vertical Programming—articulation K-12- is the most effective way of ensuring that students are prepared for high school • Middle- and High-School staff should know student needs at least 12-16 month ahead of time. • An agreed upon “method” of vertical communication of student data/needs—that leads to vertical programming– is critical
Differences in Consensus Building between Elementary and Secondary Schools • The “Compelling Why” of RtI2Implementation is different for Secondary Schools • Elementary consensus building typically begins with the identification of specific academic problems (e.g., Reading) • All teachers typically teach reading and thus reading issues are seen as relevant to everyone • Consensus is more complex to develop at the secondary level where most personnel are content specific and generally most interested only in their own content area • Even cross-content problems (e.g., student literacy) do not typically constitute a strong enough hook to build consensus around the need for RtI2Implementation • Teacher autonomy and isolation reinforces the idea that even cross-content problems are someone else’s problem
INFRASTRUCTURE INFRASTRUCTURE CONSENSUS CONSENSUS Framework for Change CONSENSUS IMPLEMENTATION SUSTAINABILITY **Consensus Building throughout the Phases
Consensus Building in Secondary Schools • Consensus building often begins by redefining the mission of the school to include graduation for all students. • All staff contribute to the preparation of students for successful completion of high school. • All high schools have graduation data readily available and most current graduation rates are significantly different from what staff would expect or desire. • Redefining Middle School’s mission to include preparing students to successfully complete high school will help to strengthen vertical articulation and the effectiveness of feeder patterns
Mission Statement:XXXXX High School XXXXX High School creates a sound educational environment that provides all students the opportunity to develop their individual talents, to meet and exceed graduation requirements, and to become productive citizens in an increasingly complex and global society
Mission Statement:XXXXX High School XXXXX High School creates a sound educational environment that provides all students the opportunity to develop their individual talents, to meet and exceed graduation requirements, and to become productive citizens in an increasingly complex and global society
Mission Statement:XXXXX High School XXXXX High School creates a sound educational environment that provides all students the skills and habits of mind to meet and exceed graduation requirements and to become productive citizens in an increasingly complex and global society
Consensus Building in Secondary Schools • Developing an Early Warning System will assist schools in establishing a need for early identification of at-risk students, tiered intervention, progress monitoring, and data-based decision making • Compare the percent of students who are off-track for graduation or at-risk for high school dropout to the school’s mission of graduating all students • Discuss the impact of course failures, student engagement, and retentions on student graduation rates • Discuss the advantage of keeping students on track for graduation instead of reacting only after they have become significantly off-track
Extreme Off Track 2-3 Years Behind No chance for graduation in a traditional school setting Disengagement Example: Credits Earned 1st Semester 09-10 < 3 Credits 08-09 < 9 Credits 07-08 <15 Credits 06-07 < 21 Credits High Off Track Lacking 2 or more graduation requirements Behind 4 or more Credits Currently failing 3 or more classes Excessive Referrals and/or Absences Off Track Lacking 2 graduation requirements Behind 1-3 Credits 10% Absences 3 or less Level 2 referrals or 2 Level 3 Referrals 9th graders indentified “at high risk” (3 F’s in 8th grade) • At Risk for Off Track • Lacking 1 of 3 Graduation requirements • < 5%Absences • 3 or less Level 1 or 2 referrals On Track Exceeding or Meeting all graduation requirements (Credits, FCAT Score, GPA) 6 or less Absences No referrals Pasco County Schools
Early Warning Systems Data:School Example 52.8% (210) of last year's 9th graders are off-track for graduation • 19% (75) are off-track due to failed FCAT, Credits and GPA • 13% (52) of exiting 9th graders failed 3 or more courses • Almost all of these students are part of the lowest 25% • Many of these students will count in the total graduation and at-risk graduation rates • These students have less than a 15% chance of graduating without significant intervention Course Failures • Algebra 1 - 43.5% • Spanish 1 - 45% • World History- 29% • English 1 - 28% • Health - 58 students- 17%
Grade 9 On Track: 348 At Risk: 39 Off Track: 53 Dropout: 0% Grade 10 On Track: 147 At Risk: 53 Off Track: 157 Dropout: 1% Grade 11 On Track: 150 At Risk: 27 Off Track: 95 Dropout: 8% Grade 12 On Track: 200 At Risk: 26 Off Track: 49 Dropout: 6%
XXX High School More than 2100 Hours (351 Days) of Instructional Time Recouped during 2009-2010 School Year School is on-track to meet 2010-2011 Goal
XXX High School School is not currently on-track to meet absenteeism goal and is in the process of revising the intervention plan
XXX High School School has added 1 hour to the school day to provide tiered intervention services for Algebra 1 and English 1
Academic Calendars • SBLT Meetings • Grade-/Department-Level Meetings • Data Days • Minimum of 3 per year • Professional Development and Support • Outcome Sharing Events • Communication and Celebration
Schedules • Maximize academic engaged time in critical areas • Reflect needs of students • Maximize use of all staff • Ensure time allocated for Tiers 1, 2 and 3 • Provide meeting time for tier integration work
Development of Schedules • How many students require immediate interventions—by grade level? • Preteach - Reteach Periods • Extra scoops (Double Dips) • How many students require “moderate risk” interventions—time and focus? • How many students require “high risk proximal and distal interventions ?
Schedule Development • Schedules are driven by how many students need how much time of what. • Schedules cannot be developed successfully without this basic information.
Middle/High School Dilemma • Deadly combination • Poor Skill Development • Limited or No Productivity (work completed, practice) • How do you remediate gaps and provide students with access to content simultaneously? • How do you sustain student engagement when skill gaps are significant?
Instructional Strategies and School Schedules • Immediate Instruction/Intervention Strategies • What they need now • Increase supervision and/or lower the level of difficulty • Eventual Instruction/Intervention Strategies • Target development of skills • Require time to develop
Immediate Strategies • Preview-Review-Reteach • Requires schedules to permit intervention in the period prior to the target class • “Double-Dip” or Double Block • Requires schedules to permit back-to-back schedule of target class with same teacher • “Alternate Core” • Requires separate class to provide supervision • Tier 1 Supports—e.g., computer assisted instruction
Eventual/Distal Strategies • Multi-year intervention plan to close gap • Integration of interventions across all providers • Integration of core content with all interventions • Perhaps modification of post-secondary trajectory
Problem Solving Process • Define the Problem • Defining Problem/Directly Measuring Behavior • Problem Analysis • Validating Problem • Identify Variables that contribute to problem • Develop Plan • Evaluate • Response to Instruction & Intervention (RtI2) • Implement Plan • Implement As Intended • Progress Monitor • Modify as Necessary
Steps in the Problem-Solving Process • Problem Identification • Identify replacement behavior • Data- current level of performance • Data- benchmark level(s) • Data- peer performance • Data- GAP analysis • Problem Analysis • Develop hypotheses (brainstorming) • Develop predictions/assessment
Step 1 - What’s the Problem? In order to identify a problem, you’ve got to start with three pieces of data: 1. Benchmark level of performance 2. Peer level of performance 3. Student level of performance
Step 1 - What’s the Problem? Is this an individual student problem or a larger systemic problem? Are over 20% of Are between Are 5% or fewer students struggling? 5% and 20% of students struggling? students struggling? Examine instruction, Go to individual student problem solving Develop small curriculum, and group environment for intervention needed adaptations and develop group intervention Go to intervention evaluation
B A S E L I N E Classroom Behavioral Data 80 % Benchmark 35 % = Student = Peer Group = Aim Line
Scholastic Reading Inventory (SRI) Which students may require additional instruction and/or intervention?
TIER I: Core, Universal Academic and Behavior GOAL: 100% of students achieve at high levels Tier I: Implementing well researched programs and practices demonstrated to produce good outcomes for the majority of students. Tier I:Effective if at least 80% are meeting benchmarks with access to Core/Universal Instruction. Tier I: Begins with clear goals: What exactly do we expect all students to learn ? How will we know if and when they’ve learned it? How you we respond when some students don’t learn? How will we respond when some students have already learned? Questions 1 and 2 help us ensure a guaranteed and viable core curriculum
Tier 1: Critical Questions • What percent of students receiving only Tier 1 are proficient? • Those who are not are falling through the cracks • What percent of students receiving only Tier 1 are proficient by NCLB category? • How effective is core instruction? • Remember, Tiers 2 and 3 cannot accommodate more than 20% of students. If more than 20% of students are not proficient, then...
Tier 1 Data Analysis-Building Level:Step 1 • Identify the number and names of students who are in core instruction 100% of the time. • Identify the number and names of students who receive supplemental instruction. • Identify the number and names of students who receive intensive instruction. • Calculate the % of students who receive only Tier 1, core instruction. • Is this at, above or below 80%? • Same for Tiers 2 and 3? • What does the distribution look like? A triangle, a rectangle?
Tier 1 Data Analysis-Building Level:Step 2 • What % of Tier 1 students made proficiency? • What % of Tier 2 students made proficiency? • What % of Tier 3 students made proficiency? • What was the overall % of students who made proficiency? • Calculate by disaggregated groups.
Data Example • 75% of students receiving only Tier 1 instruction are proficient (70% of the school). • What does this mean to you? How do you prioritize these students? • 52.5% of students are proficient • 17.5 % of students are not proficient & are not receiving additional services—Falling through the cracks. • 42% of students receiving Tier 2 (22% of school) & Tier 1 are Profic. • What does this say about the effectiveness of Tier 2 instruction & what does it say about overloading Tier 3? • 9% of students are proficient • 35% of students receiving Tier 3 (8% of school) are proficient. • Is Tier 3 effective? • 2.8% of students are proficient • Total % of school proficient: 52.5 + 9 + 2.8= 64.3
Tier 1 Data Analysis-Building Level:Step 3 • By disaggregated groups, plot the % of students who made proficiency for the past 2 years. • Calculate the % of average growth per year for each group. • % proficient in year 3 minus % proficient in year 1 divided by 2 =average rate of increase in % of students making proficiency
Finding the Average Rate of Growth 2008-09 2009-2010 2010-11 56.4 (53.6) 62.1 8.5% increase 3 years of data, but 2 data points
Finding the Average Rate of Growth 2011-12 Target = 87.0% 2008-09 2009-2010 2010-11 56.4 (53.6) 62.1 62.1 – 56.4 = 24.9 24.9 divided by 3 = 2.85% rate of growth
Example • Low Income Students 62.1% • Desired Level 87.0% (11-12) • Current level 62.1% (10-11) • Gap 24.9% • 2 year rate 2.85% • 62.1 - 56.4 divided by 2 = 2.85% (10-11) – (08-09) It will take 8.7 years to close the gap at this rate