Download
1 / 26
260 likes | 337 Views
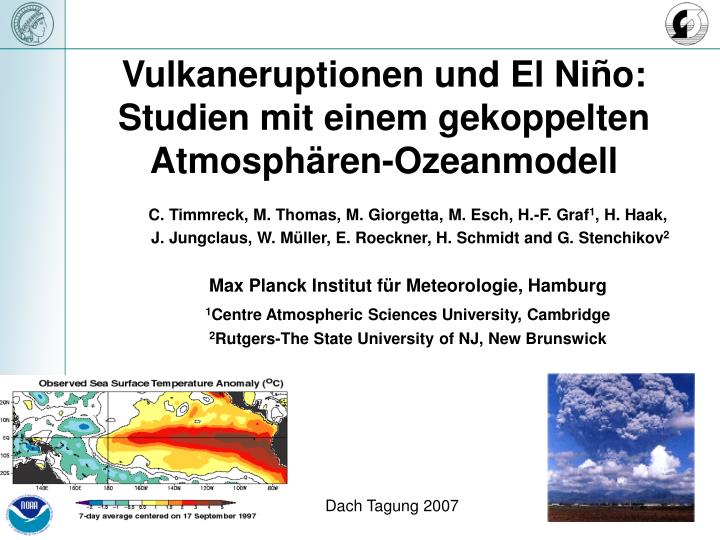
Vulkaneruptionen und El Ni ñ o: Studien mit einem gekoppelten Atmosphären-Ozeanmodell. C. Timmreck, M. Thomas, M. Giorgetta, M. Esch, H.-F. Graf 1 , H. Haak, J. Jungclaus, W. Müller, E. Roeckner , H. Schmidt and G. Stenchikov 2 Max Planck Institut für Meteorologie, Hamburg

E N D
Vulkaneruptionen und El Niño: Studien mit einem gekoppelten Atmosphären-Ozeanmodell C. Timmreck, M. Thomas, M. Giorgetta, M. Esch, H.-F. Graf1, H. Haak, J. Jungclaus, W. Müller, E. Roeckner, H. Schmidt and G. Stenchikov2 Max Planck Institut für Meteorologie, Hamburg 1Centre Atmospheric Sciences University, Cambridge 2Rutgers-The State University of NJ, New Brunswick Dach Tagung 2007
Gekoppelte El Niño Vulkan Läufe o • Sehr grosse Vulkaneruptionen haben einen signifikanten Einfluß auf Klima, chemische Zusammensetzung und atmosphärische und ozeanische Zirkulation. • In den Wintern nach den grössten Eruptionen der letzten Jahrzehnte (Agung, 1963; El Chichón, 1982; und Mt. Pinatubo,1991) fanden El Niños statt. • Rekonstruktionen aus Paleodaten (Adams et al, 2003) zeigen, dass sehr große Vulkaneruptionen die Wahrscheinlichkeit eines El Nino Ereignisses erhöhen. • Gekoppelte Atmosphären-Ozeanmodelle sind ein wichtiges Werkzeug, um unser Verständniss des kombinierten Effektes von El Nino und Vulkaneruptionen auf die Atmosphären und Ozeanzirkulation zu verstehen.
Optical depth in the visible Gekoppelte El Niño Vulkan Läufe • We have carried out a series of volcanic simulations with the AOGCM,ECHAM5/MPIOM. • The volcanic radiative forcing is calculated online in the model using a realistic spatial-temporal distribution of aerosol optical parameters derived from satellite observations for the Pinatubo episode.
Niño 3.4 SST anomalies in ECHAM5/MPIOM The frequency analysis of the El Niño events show good agreement with observations. However, the amplitude of 1.7 K is higher than in the IPCC runs (1.5 K) and in the AMIP cases (1.K)
Niño 3.4 Case I Niño 3.4 Case III Gekoppelte El Niño Vulkan Läufe Niño 3.4 Case II • Three different cases are selected from a 100 year control run. • 5 ensembles for Jan and June, perturbed / unperturbed. • Each ensemble run has been performed for two years.
Net flux anomalies [W/m2] TOA SURFACE While 1 year after the eruption the radiative forcing at the TOA decreases significantly it remains at the surface in the tropics around -4 W/m2 throughout the 2nd year
Stratosphärischer Temperaturresponse [K] Case I Juni ERA 40 Reanalysen 30 hPa 50 hPa 100 hPa
Temperaturresponse in 50 hPa Case I Januar Case I Juni Case II Januar Case II Juni Case III Juni Case III Januar
Case II January Case II June GPH Anomaly 50 hPa DJF „91/92“ Case I January Case I June Era 40 Reanalysis
Case II January Case II June 2m temperature anomaly [k] DJF „91/92“ Case I January Case I June Era 40 Reanalysis
Atmosphärischer Response • Der stratosphärische tropische Temperaturresponse ist ähnlich in allen Fällen und in Übereinstimmung mit Beobachtungen. • Der dynamische Response in den hohen Breiten der Nordhemisphäre ist sehr variabel. Nur in einigen Fällen wird das beobachtete Muster wiedergespiegelt. • Weitere Analysen (EP Flüsse, Refraktionsindices) sind notwendig • Achtung: Modellobergrenze bei 10 hPa !
Temperaturanomalien an der Oberfläche [K] Global gemittelte Oberflächentemperaturanomalien sind mit 0.3 K niedriger als die MSU Temperaturanomalien nach der Pinatuboeruption (0.4-0.5 K).
Oberflächenemperaturanomalien [K] Sommereruption Global Global Land Meer
Oberflächenemperaturanomalien [K] Wintereruption Global Global Land Meer
Nino 3.4 SST Anomalien Initialization of volcanic forcing in January Initialization of volcanic forcing in June
Gekoppelte El Niño Vulkan Läufe • Unsere Modellergebnisse können die Hypothese, daß Vulkane die Wahrscheinlichkeit für ein El Niño Ereigniss erhöhen, nicht bestätigen. (Grössenordnung einer Pinatubo Eruption ) • Modellergebnisse mit dem Ocean Thermostat modell (Emile-Geay, Spring AGU 2007) zeigen, dass Vulkane grösser Pinatubo die El Niño Wahrschienlichkeit erhöhen -> Simulation für eine sehr große Vulkaneruption z.B. 100 X Pinatubo • Der dynamische Response im Ozean ist stark variabel und variiert zwischen den einzelnen Fällen, aber auch sehr stark zwischen den einzelnen Ensemblemitgliedern. • Weitere Analysen sind notwendig, um zu verstehen, was sich hinter den physikalischen Mechanismen verbirgt und warum sich die einzelnen Ensemblemitglieder unterschiedlich verhalten. • Fortführung der Läufe, da das Oberflächentemperatursignal nach 2 Jahren noch nicht wieder im Gleichgewicht ist.
Zusammenfassung Wir hatten einige Fragen bevor wir angefangen haben Nun haben wir noch mehr. Vielen Dank für Ihre Aufmerksamkeit!
Case I Nino 3.4 STD
Case II Nino 3.4 STD
Case III Nino 3.4 STD
Ocean Ocean All All Land Land Ocean Ocean All All Land Land Surface Temperature Anomalies [K] Global Northern Hemisphere Tropics 30N 30S Southern Hemisphere