Download
1 / 23
230 likes | 329 Views
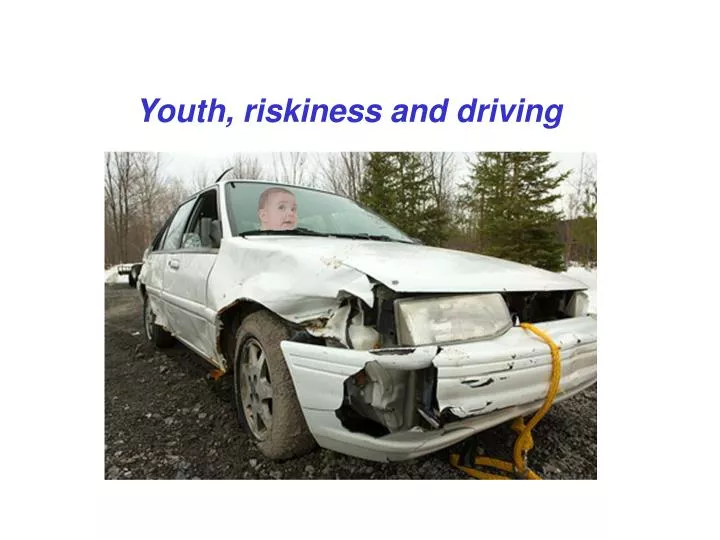
Youth, riskiness and driving. Younger drivers are at more risk of a road accident: NHTSA (2003): 16-24 year-olds = 14% of U.S. population, but 25% of traffic deaths. Age-related decline in accident rates, with increase for drivers aged 75+.

E N D
Younger drivers are at more risk of a road accident: NHTSA (2003): 16-24 year-olds = 14% of U.S. population, but 25% of traffic deaths. Age-related decline in accident rates, with increase for drivers aged 75+. Males and females show same age-pattern, but males have more accidents than females at all ages. Pattern has remained constant over time (e.g. McKenna et al 1998, Laapotti and Keskinen 2004). Same pattern found in all developed countries. Percentage of licensed drivers in that age-group South Australia 1994 -1998, Baldock and Maclean (2005)
Interpretation of statistics is complicated by exposure issues: Brorsson et al (1993): 40x more dangerous to drive on Friday and Saturday evenings than at other times. DFT (2010): alcohol involved in 17% of road deaths, 47% of driver deaths between 10 pm - 4 am. Young drivers (17-24) over-represented in alcohol-related accidents.
U.K. deaths in 2008. (DFT (2010) "Reported Road Casualties Great Britain 2010"):
Age- and sex-differences in types of accident (e.g. Laapotti and Keskinen 2004): 2,401 fatal Finnish car accidents. Running off road: 47% of all fatal accidents for young males, 26% for young females. Head-on collisions: 41% of all fatal accidents for young males, 58% for young females. Young males 3x more likely than young females to be involved in a fatal drink-driving accident, and nearly 4x more likely to have previous traffic offences. Females more likely than young males to have a accidents due to reversing or loss of control (e.g. skids).
Risk Homoeostasis Theory: Wilde (1982, 1988, 2002): Individuals adjust their behaviour in order to maintain a preferred level of risk. Implications - many "safety" measures are futile. Only way to affect accident statistics is by changing target levels of risk (i.e. motivational manipulations). e.g. provide incentives for safe driving (insurance discounts)
Evidence for and against RHT: Accident statistics are equivocal. Sagberg, Fosser and Saetemo (1997): some confusion between effects on accident rates of primary and secondary safety measures (e.g. anti-lock brakes and seat-belt use).
Evidence for and against RHT: McKenna (1988), Hole (2007): better approach is to use research on psychology of risk-perception. If risk-assessment is unreliable, then RHT must be untenable. Wealth of evidence shows people are poor at judging risk...
1. Drivers get little feedback about the risks of driving - Accidents are rare on an individual level, if not on a societal level (Rumar 1988); Risky behaviours may not have consequences; Accident rates are not wholly under an individual's own control (may be an innocent victim); Poor at remembering accidents and near-accidents: overall, 80% of near-accidents are forgotten within a fortnight (Chapman and Underwood 2000). (forgetting varied from 95% of events rated as having produced `little danger of accident' to 50% of events that produced a "large danger of an accident").
2. Drivers are poor at assessing risks - Decision-making is irrational and prone to bias. e.g. "availability heuristic" (Tversky and Kahneman 1972). Baksteen (1995): in 1985, the risk of dying in a car accident in the U.S. was 1 in 5,300, and the risk of dying in a terrorist attack outside the U.S. was 1 in 1,600,000. Deaths from terrorism were well publicised and led to many Americans avoiding foreign travel in 1986; probably few avoided using their car for that year, the more rational course of action to avoid being killed.
2. Drivers are poor at assessing risks (cont .) - Risk assessment affected by perceived consequences (immediacy, severity), control, frequency, familiarity. Self-serving bias - individuals consider themselves less likely to experience unpleasant things and more likely to experience pleasant things. Most drivers overestimate their own abilities (Svenson 1981, Horswill, Wayland and Totfield 2004). Due to self-serving bias, trait/situation attributions? Duncan, Williams and Brown (1991): experience does not inevitably lead to expertise, perhaps because of lack of feedback.
3. Risky drivers do not show risk compensation - Seat-belt non-users tend to be young, male, drive more riskily, and have higher accident rates and violations (Hunter et al 1993). Seat-belt non-users use drugs and alcohol more (Foss et al 1994; Li et al 1999). Users of hand-held mobile phones are less likely to wear a seat-belt (Eby and Vivoda 2003). Speeding drivers may have "risk-mitigating beliefs" that reduce the perceived risks of speeding - e.g. "I can drive safely at speed" , "only really high speeds are dangerous" (Brown and Cotton 2003).
Zero-risk theory (Naatanen and Summala 1974, Summala, 1988, 1997): Drivers seldom think about risks or experience risk. Vehicle control is based largely on habit. Accidents arise because (a) drivers underestimate the amount of variance in the traffic system; (b) drivers are motivated to speed - have a distorted "speed utility function". Safety margins are inadequate as a consequence. Can reduce accidents by tackling these two factors (e.g. engineering for (a), enforcement for (b)).
Individual differences and risky driving: (a) Vehicle control (skill) differences? Horswill et al (2004): hazard perception skills are correlated with safety, not vehicle control skills - but drivers believe the opposite. Williams and O'Neill (1974): racing drivers have more accidents than controls. Lajunen, Corry, Summala and Hartley (1998): Two "personalities"? One skill-oriented, one safety-oriented. Drivers who rate their vehicle control skills highly tend to drive more riskily and drive faster. Self-ratings affect speed, which affects accident risk?
Individual differences and risky driving: (b) Lapses, errors and violations: Reason et al (1990), Aberg and Rimmo (1998): Aberrant driver behaviours consist of "errors" : inappropriate acts, e.g. missing a "Give Way" sign; "slips" and "lapses": unintended omissions of actions, e.g. forgetting to cancel an indicator; "violations": deliberate floutings of law or safe practice, e.g. running a red light.
Parker et al (1995), Westerman and Haigney (2000): Errors more common in women, and do not decrease with age. Lapses increase with age. Violations more common in men and in drivers who rate themselves as skilful; show age-related decline. Propensity to violate is associated with greater risk of accident involvement (e.g. Parker et al 1995; West, Elander and French 1993).
Individual differences and risky driving: (c) Sensation seeking (Zuckerman 1994): "...defined by the seeking of varied, novel, complex and intense sensations and experiences and the willingness to take physical, social, legal and financial risks for the sake of such experiences". SS higher in males than females, and declines with age in both sexes. Rimmo and Aberg (1999): SS associated with violations. SS leads to violations, which lead to accidents? But - fairly weak correlations between SS and driving behaviours (.3 - .4 range). Arnett (1996): reckless behaviours are widespread amongst young drivers - not confined to high-SS group.
(d) Anger and aggressiveness: Arnett (1996): aggressiveness moderately correlated with frequency of risky driving behaviours in a student sample. "Driving Anger Scale" (Deffenbacher et al 1994): High anger drivers 4x more likely to show aggressive behaviours while driving, and 2x more likely to engage in risky behaviours. "Propensity of Angry Driving Scale" (DePasquale et al 2001, Maxwell et al 2005): Aggressive drivers more likely to commit violations; scores highest for young male drivers. No correlations between DAS or PADS and accident rates.
Role of personality factors in accidents: Rimmo and Aberg (1999): "...despite the myriad of studies designed to relate different constructs of personality to accident involvement, only limited success has been attained". Test scores account for only 5-10% of variance in accident rates. Reasons - Imperfect measurement of traits by questionnaires. Accidents usually have multiple causes; personality factors may be only the starting point in a chain of events culminating in an accident.
Interactionist model of risky driving (Taubman-Ben-Ari et al, 2004): Personal and environmental influences on riskiness of driving: Personal - perceiving reckless driving as a challenge, considering oneself able to cope with it, disregard for possible negative outcomes. Environmental - perceiving that friends and family behaved similarly, and approved of one's risky actions. Model still only explained 43% of the variance in risky driving scores - maybe remainder is accounted for by personality variables, e.g.. sensation seeking.
Interactionist model of risky driving (Ulleberg 2003): Cluster analysis of a battery of measures of personality and attitudes to risk, accident records. Six clusters of drivers: two "low risk", two "high risk". High-risk A:high on sensation-seeking, normlessness, driving anger, low on altruism and anxiety. High scores on risk-taking behaviour, poor attitudes to risk and low risk perception measures. Rated own driving skills highly, but had highest accident rates. 81% were male. High-risk B -high on sensation seeking, aggression, anxiety and anger, low on altruism. Risky driving habits, poor attitudes to road safety, high accident rates. Did not rate their own driving skills as very good, and perceived risk of accident as high. 59% were female. High-risk groups less receptive to road safety campaigns than low-risk groups.
Lifestyle factors in risky driving (Moller 2004): In-depth interviews with 29 Copenhagen young drivers.
Conclusions: Riskiness of younger drivers arises from a lethal combination of: Adequate vehicle control skills, but poor hazard perception skills (Hall and West 1995). Under-20's underestimate traffic hazards and overestimate their own abilities (Brown and Groeger 1988). Peer pressure (Simons-Morton, Lerner and Singer 2005). Personality factors, especially sensation seeking. Alcohol and drugs. Increased exposure to risk (drive more often at night). Need to improve risk perception, and reduce risk acceptance.