Download
1 / 31
310 likes | 413 Views
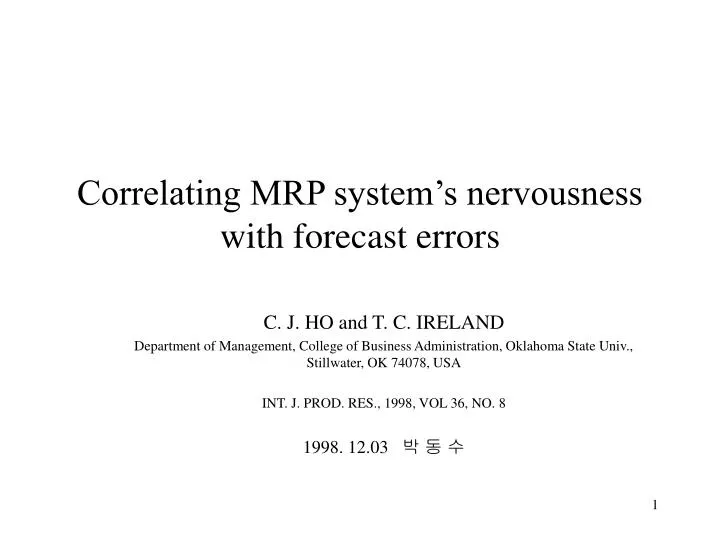
Correlating MRP system’s nervousness with forecast errors. C. J. HO and T. C. IRELAND Department of Management, College of Business Administration, Oklahoma State Univ., Stillwater, OK 74078, USA INT. J. PROD. RES., 1998, VOL 36, NO. 8 1998. 12.03 박 동 수. Contents. Introduction

E N D
Correlating MRP system’s nervousness with forecast errors C. J. HO and T. C. IRELAND Department of Management, College of Business Administration, Oklahoma State Univ., Stillwater, OK 74078, USA INT. J. PROD. RES., 1998, VOL 36, NO. 8 1998. 12.03 박 동 수
Contents • Introduction • Related research • Research design • Experimental results and analysis • Summary and conclusion
Introduction • Research on forecasting • no lack of research in evaluating the performance of various forecasting techniques. • does not seem to be a forecasting method that performs satisfactorily in all production environment • But the pursuit of a ‘better’ forecasting method, seems to become a major task of production schedulers. Accurate forecasting stable MPS MRP without schedule change
MRP System’s nervousness • frequent changes in the due dates of open orders • significant changes in MRP plans, which occurs even with only minor changes in higher -level MRP record or MPS. • Problems of nervousness • confusion on the shop floor • high rescheduling cost • fluctuation in capacity utilization
Item A POQ = 5 weeks Item A POQ = 5 weeks LT = 2 weeks LT = 2 weeks Week 1 2 3 4 5 6 7 8 Week 1 2 3 4 5 6 7 8 GR 2 24 3 5 1 3 4 50 GR 2 23 3 5 1 3 4 50 SR SR PAB 28 26 2 13 8 7 4 0 28 PAB 28 26 3 0 8 7 4 0 0 POR 14 50 POR 63 Component B POQ = 5 weeks Component B POQ = 5 weeks LT = 4 weeks LT = 4 weeks Week 1 2 3 4 5 6 7 8 Week 1 2 3 4 5 6 7 8 GR 14 50 GR 63 SR 14 SR 14 PAB 2 2 2 2 2 2 0 0 0 PAB 2 16 -47 POR 48 POR 47 변경 전 변경 후
The purpose of this paper is to investigate whether forecast error translates into a significant problem of system nervousness at the lower levels of the production system.
Related research • To deal with forecast errors • inventory-oriented buffering methods such as safety stock, safety lead time • information manipulation approach(rescheduling of MRP) • Inventory-oriented buffering methods • uncertain quantity : safety stock • uncertain timing : • Whybark and William(1976) : safety lead time • Grasso and Taylor(1984) : It is more prudent to use safety stock instead of safety lead time to counteract timing uncertainty. • Further studies are required to resolve those contradictory conclusion.
Rescheduling capability of MRP system • Ho and Ireland(1993) : evaluated the impact of forecast errors on the performance of an MRP system involving multi-level product structures. • Zhao and Lee(1993) : considered MPS freezing to deal with forecast errors. • Forecast errors significantly increase total costs, and reduce the service level in multi-level MRP systems. • This paper extends previous works in the following directions by : • considering the relationship between forecast errors and the resultant system nervousness under various operating environment. • Explicitly and specifically considering rescheduling measurement. • Examining such important environmental uncertainties as LT uncertainty and demand variation .
Research design • Weekly, regenerative MRP + uncertain variation • Hypothesis testing • H1 : For any given lot-sizing rule used, there is no significant difference in system nervousness generated under different degree of FE tested.(LS FE) • H2 : For any given level of LT uncertainty tested, there is no significant difference in system nervousness generated by any LS rule under various degrees of FE tested(LTU LS FE) • H3 : For a given level of demand lumpiness(DL), there is no significant difference in system nervousness generated by any LS rule under various degrees of FE tested(DL LS FE) • H4 : Given a setup/carrying cost ratio(CR), there is no significant difference in system nervousness generated by any LS rule under various degrees of FE tested(CR LS FE)
Factorial design FE DL LTU LS CR • Normal with • mean = 0 • & • ST = 30 • ST = 60 • Normal with • mean = 100 • & • Cv = 0.3 • Cv = 0.8 • Normal with • mean = PLT • & • Cv = 0.2 • Cv = 0.4 • LFL • EOQ • PPB • SM • 100 : 1 • 300 : 1 • 500 : 1
Performance measure : weighted rescheduling measure for ith item in jth period : order quantity of item i in the jth period to be rescheduled : new due date of item i in the jth period : original due date of item i in the jth period
Experimental procedure and assumptions • 4 final product and 20 component items • inventory carrying cost is set 20% of the item cost per year • PLT for inventory items are determined appropriately to begin with • no safety stock or safety lead time • no beginning inventory for any item at the outset of the simulation • rolling schedule with a rolling interval of one period • there is no trend, seasonal or cyclic pattern in the MPS • sample size = 5 • initialization period = 30 weeks • run length = 300 weeks
Experimental results and analysis • ANOVA results • 모든 인자의 주효과 • 4차 이상의 교호작용은 없음 F value PR > F FE*LS 71.59 0.0001 FE*LS*LTU 8.54 0.0001 FE*LS*DL 0.10 0.9604 FE*LS*CR 5.48 0.0001
FE-LS interactions • counter-intuitive result • the higher the forecast error, the less nervous the MRP system • there seems to be two distinctive groups by LS rule under both level of forecast error • this seems to imply that the selection of an appropriate LS rule in the presence of forecast errors is important.
FE-LS-LTU interactions • relative performance difference of these four LS rules is magnified by the presence of LT uncertainty. • The importance of selecting an appropriate LS rule outweighs the negative effect of the magnitude of forecast errors under uncertain operating condition characterized by the LT uncertainty.
FE-LS-CR interactions • cost structure tends to dilute the impact of forecast errors. • performance reversal between LFL and EOQ
Summary and conclusions • The existence of forecast errors has a significant impact on scheduling instability in MRP systems. • However, other operating factors, such as the use of an appropriate LS rules, may neutralize the negative impact of forecast errors • It is prudent to consider an appropriate buffers, such as safety stock at the end-item level or MPS freezing, to counteract forecast errors. • Production scheduler needs to select appropriate LS rule instead of pursuing relentlessly a ‘perfect’ forecasting method for their operation environment.
Economic production-ordering quantity model with limited production capacity M.A. Hariaga Prof. of IE at King Saud Univ., Saudi Arabia production planning & control, 1998, VOL. 9, NO. 7 1998. 12.03 박 동 수
Contents • Introduction • The models • models with only subcontracting • models with both subcontracting and overtime • conclusions
Introduction • Many research on economic production quantity(EPQ) • These assumed that the production rate is larger than the demand rate for feasibility. • In many production facilities, the production rate may not be enough to satisfy the demand due to insufficient capacity. • In such a situation, the problem is to determine the best policy to meet this large demand by adjusting the production rate through overtime and other controllable variable, e.g., subcontracting rate. • Goyal and Gopalakrishnan(1996) address the EPQ model with insufficient capacity.
But they assumed that the annual excess demand is lost. • The policy of incurring shortages in case of limited capacity is not operationally and economically appropriate because of the eventual loss of potential customers in the long run. • In this paper, we propose a production ordering policy with the assumptions that excess demand can be supplied from external source having an infinite capacity and shortage are disallowed.
Model • Assumptions • shortages are not allowed. • the external procurement LT is zero. • the external order is received at the stoppage time of the production batch. • Notations : overtime unit production cost : inventory carrying cost : regular unit production cost : daily production rate : external ordering quantity : daily demand rate(d>r) : internal production batch size : unit selling price : allowable fraction of overtime : unit purchasing cost : ordering cost : number of working days per year : setup cost : setup time (in days) : number of setup per year : unit shortage cost
D C t A B E Model without overtime = = = = = • Annual sales revenue • Annual manufacturing cost • Annual purchasing cost • Annual setup cost • Annual ordering cost • Annual inventory cost = =
Maximize annual gross profit • Annual gross profit = • Find optimal setup number N* • N* =
Example • Consider the situation where the units purchasing cost is equal to the selling price and ordering cost is equal to the internal setup cost. • Daily demand= 40 units/day • Number of working days in a year = 250 days • Shortage cost = $5/unit/year • Setup cost = $250/setup • Daily production = 36 units/day • Selling price = $40/unit • Production cost = $30/unit • Inventory carrying cost =$6/unit/day • Setup time = 0.5 days/setup
Comparison with C&G Optimal setup # Gross profit g v O G&G Hariga G&G Hariga 5 40 250 10.4 9.51 75382 78122 4 40 250 10.65 9.51 76572 78122 3 40 250 10.86 9.51 77762 78122 2 40 250 11.1 9.51 78963 78122 5 30 250 10.4 11.3 75382 89978 5 30 50 10.4 15.1 75382 92557 5 35 50 10.4 12.94 75382 86302
Model with overtime • Increased daily production rate R = r(1+ ) • If R>d, straightforward(N = m(1-d/R)/t). • If R<d, • R = r(1+ ) • V=v(1+ ) <- just notation • C=Cr+ Co • N* =
Example • Daily demand = 50 units/day • Daily production = 36 units/day • Setup cost = $250/setup • Ordering cost = $50/setup • Regular unit production cost = $30/unit • Overtime unit production cost = $32/unit • Selling price = $40/unit • Purchasing cost = $35/unit • Shortage cost = $5/unit/year • Inventory carrying cost = $1/unit/year • Allowable fraction of overtime = 0.25
R = 45 unit/day • V = $43.75 • C = $38 G&G Subcontracting Subcontracting & overtime # of setup Profit # of setup Profit # of setup Profit 3.86 68518 5.25 103422 5.42 109894
Conclusions • In many production facilities, the production rate may not be enough to satisfy the demand due to insufficient capacity. • The policy of incurring shortages in case of limited capacity is not operationally and economically appropriate because of the eventual loss of potential customers in the long run. • In this paper, we proposed a production ordering policy with the assumptions that excess demand can be supplied from external sourcehaving an infinite capacity and shortage are disallowed.
References • C.J. Ho and T.C. Ireland,1998, Correlating MRP system nervousness with forecast errors, Int. J. Prod. Res., 36 • C.J. Ho and T.C. Ireland, 1993, A diagnostic analysis of the impact of forecast errors on production planning via MRP system nervousness, production planning and control, 4 • Zhao, X. and Lee, T. S., 1993, Freezing the MPS for MRP systems under demand uncertainty. Journal of Operations Management, 11 • M. A. Hariga, 1998, Economic production-ordering quantity models with limited production capacity, production planning & control, 9 • Goyal, S. K. and Gopalakrishnan, M., 1996, Production lot sizing model with insufficient production capacity, Production planning & control, 7