Download
1 / 15
150 likes | 254 Views
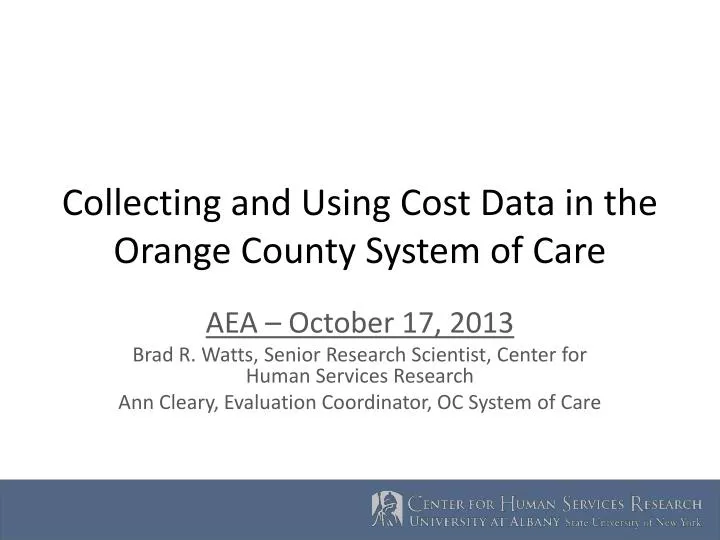
Collecting and Using Cost Data in the Orange County System of Care. AEA – October 17, 2013 Brad R. Watts, Senior Research Scientist, Center for Human Services Research Ann Cleary, Evaluation Coordinator, OC System of Care. Overview.

E N D
Collecting and Using Cost Data in the Orange County System of Care AEA – October 17, 2013 Brad R. Watts, Senior Research Scientist, Center for Human Services Research Ann Cleary, Evaluation Coordinator, OC System of Care
Overview The System of Care approach is a new way of providing mental health services to children that has been adapted in Orange Co. New York . • What is System of Care? • A look at collecting costs from multiple sources in a loose-knit system • Challenges and lessons learned • What was done with the cost data? • Aggregate costs used by the Feds • What we can add and findings
Required Evaluation Components • Descriptive Study (demographics, diagnostic info, and enrollment status) • Longitudinal Outcome Study (every 6 mos. for 2 years; measures improvement at home, in school, and in the community) • Services and Costs Study (tracks every service rec’d by every child enrolled into the Longitudinal Outcome Study, as well as who provided that service, who was charged how much, and who paid how much)
From Data Collection Perspective, Two Main Tasks • Identify Services Received • Collect Costs data from agencies providing the services • Usually two step process: • Program Staff provide type, dates, and units of service • Fiscal Staff provide associated costs and payer data
Challenges • Heavy burden on agency staff • Differences between agencies in how spending and payment are tracked • Impossible to quantify what data is missing • Tension between what is useful locally and what is useful nationally
Looking at Cost Data • SAMHSA looked at a lot...but their interests may be different: “The primary purpose of the services and costs study is to describe the types of services received by children and youth and their families, their service use patterns, and the costs associated with these services.” • We looked at what could benefit OC, what has already been done, and what is still possible.
Examples of Data from their ReportWhat do they tell Orange Co? Important, but very general info. Source: Comprehensive Community Mental Health Services for Children and Their Families Program. Services and Costs Study Data Report: Orange County System of Care. July 2013.
Macro vs. Micro • Two distinct audiences, both purse string holders: • The Feds • County level Department Heads • SAMHSA uses data to see what happened overall; locally Dept. Heads want to know how service provision has changed due to grant. • Federal scale: to fund or not? • Local scale: how to sustain? i.e., where are there savings and shifts? Opportunities for reinvestment?
Average Costs to Serve an Individual • Challenge: on-going program starts & exits; children may leave and return. • Solution: use individual enrollment/discharge dates and costs by service start date. Average per Child in System of Care Study • 400 days enrolled in SOC • $3,370 cost per month enrolled • Around $44,300 to serve average study participant
Cost flows: Do costs vary over time in the SOC?Reason: look for “peaks” and at role of hard-cases.
Outcomes: Change divided by cost reveals average outcome per dollar expenditure in SOC. Standardized outcome measure changes from baseline, on average, for every $10,000 spent on a child in the SOC. Standardized changes in outcome measures by a fixed dollar amount help to illustrate which conditions are comparatively easier to impact.
Lessons learned • Access to data comes by way relationships—build them • Perspective determines which costs matter: Use national study design as a starting point; ask “What is useful locally?” before you begin collecting data • Plan for independent analysis • Consider how community looks at and uses existing costs data • Additional data fields (agency ID)
Lessons Learned • Determining cost-effectiveness requires knowing something about how the outcomes should be changing. • Standardization of outcomes is the way to go, BUT you need a good population to measure variance • Program-level vs. individual level cost trends can be very different.
Collecting and Using Cost Data in the Orange County System of Care AEA – October 17, 2013 Brad R. Watts, Senior Research Scientist, Center for Human Services Research Ann Cleary, Evaluation Coordinator, Orange County NY System of Care