Download
1 / 15
150 likes | 164 Views
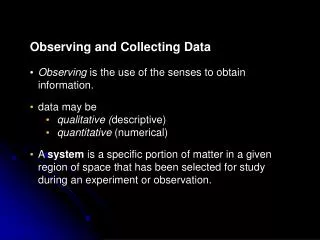
Data and Examples of Collecting Data. The information we gather with experiments and surveys is collectively called data Example: Experiment on low carbohydrate diet Data could be measurements on subjects before and after the experiment Example: Survey on effectiveness of a TV ad

E N D
Data and Examples of Collecting Data • The information we gather with experiments and surveys is collectively called data • Example: Experiment on low carbohydrate diet • Data could be measurements on subjects before and after the experiment • Example: Survey on effectiveness of a TV ad • Data could be percentage of people who went to Starbucks since the ad aired
Define Statistics • Statistics is the art and science of: • Designing studies • Analyzing the data produced by these studies • Translating data into knowledge and understanding of the world around us
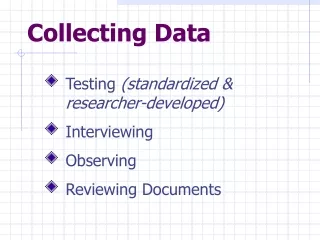
Reasons for Using Statistical Methods • The three main components of statistics for answering a statistical question: • Design: Planning how to obtain data • Description: Summarizing the data obtained • Inference: Making decisions and predictions
Design • Design questions: • How to conduct the experiment, or • How to select people for the survey to ensure trustworthy results • Examples: • Planning the methods for data collection to study the effects of Vitamin C. • For a marketing study, how do you select people for your survey so you’ll get data that provide accurate predictions about future sales?
Description • Description: • Summarize the raw data and present it in a useful format (e.g., average, charts or graphs) • Examples: • It is more informative to use a few numbers or a graph to summarize the data, such as an average amount of TV watched, or • a graph displaying how number of hours of TV watched per day relates to number of hours per week exercising.
Inference • Inference: Make decisions or predictions based on the data. • Examples: • Has there been global warming over the past decade? • Is having the death penalty as a possible punishment associated with a reduction in violent crime? • Does student performance in school depend on the amount of money spent per student, the size of the classes, or the teachers’ salaries?
We Observe Samples but are Interestedin Populations • Subjects • The entities that we measure in a study. • Subjects could be individuals, schools, rats, countries, days, or widgets.
Population and Sample • Population: All subjects of interest • Sample: Subset of the population for whom we have data Population Sample
Example: An Exit Poll • The purpose was to predict the outcome of the 2010 gubernatorial election in California. • An exit poll sampled 3889 of the 9.5 million people who voted. Define the sample and the population for this exit poll. • The population was the 9.5 million people who voted in the election. • The sample was the 3889 voters who were interviewed in the exit poll.
Descriptive Statistics and Inferential Statistics • Descriptive Statistics refers to methods for summarizing the collected data. Summaries consist of graphs and numbers such as averages and percentages. • Inferential statistics refers to methods of making decisions or predictions about a population based on data obtained from a sample of that population.
Descriptive Statistics Example Figure 1.1 Types of U.S. Households, Based on a Sample of 50,000 Households in the 2005 Current Population Survey.
Inferential Statistics Example • Suppose we’d like to know what people think about controls over the sales of handguns. We can study results from a recent poll of 834 Florida residents. • In that poll, 54.0% of the sampled subjects said they • favored controls over the sales of handguns. • We are 95% confident that the percentage of all adult • Floridians favoring control over sales of handguns falls • between 50.6% and 57.4%.
Sample Statistics and Population Parameters • A parameter is a numerical summary of the population. • Example: Proportion of all teenagers in the United States who have smoked in the last month. • A statistic is a numerical summary of a sample taken from the population. • Example: Proportion of teenagers who have smoked in the last month out of a sample of 200 randomly selected teenagers in the United States.
Randomness and Variability • Random sampling allows us to make powerful inferences about populations. • Randomness is also crucial to performing experiments well.
Randomness and Variability • Measurements may vary from person to person, and just as people vary, so do samples vary. Measurements may vary from sample to sample. • Predictions will therefore be more accurate for larger samples.