Download
1 / 22
220 likes | 226 Views
This article explores the challenges of feeding the planet, including crop yields, world cereals production, and recent volatility of agricultural prices. It also highlights the achievements of GEOGLAM (Global Agricultural Monitoring) in providing relevant and accurate information on agricultural production.

E N D
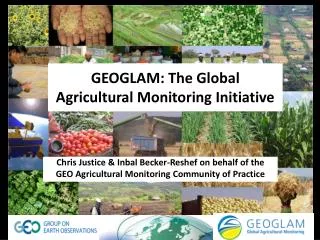
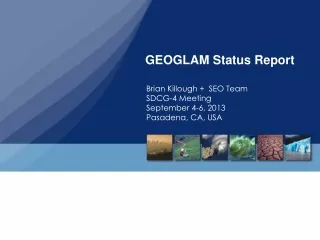
GEOGLAMGlobal Agricultural Monitoring Michel Deshayesmdeshayes@geosec.org
Challenge : Feeding the planet (1/3) Yields World CerealsProduction WorldPopulation Cropland area 1990-91 2010-11 1980-81 2000-01 World population and World area, yields and production in cereals (including rice), 1980/81 to 2010/11, base 100 in 1980/81; Source: INRA from USDA/PSD and FAOSTAT data 3/XX
Recent volatility of Agricultural Prices Monthly Wheat Prices 1960-2011($/Metric Ton)Source: World Bank Average Price2008-2012: 300$ 2010/11 Price hikes Drought: Russia 2008 Price hikes Droughts: Australia & Ukraine 1971/2’s price hike Drought: Russia Average Price1972-2007: 150$ Landsat 1 Launched (1972) Nominal wheat price in US $/metric Ton 4/XX
Effects of Production Forecasts on Market Prices (2010-2012) Aggregation of Wheat Production Forecasts from Main Wheat Export Countries vs. International Market Price ($/Ton) +17% +80% +35% -20% -27% -24% 5/XX
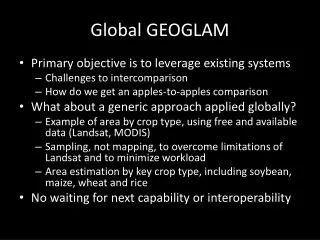
GEOGLAM: Global Agricultural Monitoring Origin in 2011: G20 creation to fight global food price volatility, together with AMIS* Objectives: To strengthen the international community’s capacity to produce & disseminate relevant, timely and accurate information & forecasts on agricultural production at national, regional & global scales, through reinforced use of Earth Observations Activities: Crop Monitors, Capacity Building, Rangelands monitoring, R&D… Crop Monitor for AMIS (Corn, Maize, Rice, Soybeans) Crop Monitor for Early Warning End of August 2016 Maize Conditions End of August 2016 – 4-Crop Conditions 3 more drivers • Pest & Disease • Socio-Political • Delayed Onset 1 new condition«Failure» AMIS: Agricultural Market Information System 7/XX
Crop Monitor for AMIS & Economics • Information Asymmetry (IA) theory • In Economics, IA deals with the study of decisions in transactions where one party has more or better information than the other • From 1970, series of papers by Akerlof, by Spence and by Stiglitz • Information asymmetry imbalance of power in transactions: transactions going sometimes awry, with in worst case market failure • 2001: Nobel Price in Economics awarded to Akerlof, Spence & Stiglitz • GEOGLAM and Information (a)symmetry • By producing & openly disseminating relevant, timely and accurate information and forecasts on agricultural production… … GEOGLAM contributes to an efficient functioning of markets. 8/XX
Global Coverage of 4 Commodities (1/2)Wheat, Maize, Rice & Soybeans. Wheat + Rice + Maize =≈ 42% of world’s food energy 9/XX
GEOGLAM ActorsGEOGLAM Community of Practice Open Community made up of international and national agencies concerned with agricultural monitoring including Ministries of Ag, Space agencies, Universities, & Industry 11/XX 11 / 21
First Crop Monitor for Early Warning, Feb. 2016 Consensus Map highlighting the poor conditions in Southern Africa for Maize 1 new condition:Failure 3 more drivers: • Pest & Disease • Socio-Political • Delayed Onset 12/XX
about 94% of world agricultural area… AchievementsGlobal Crop Monitoring 14/XX
RAPPRangelands and Pasture Productivity • Objectives • establish a dedicated global system for observing pastures and rangeland status, biomass dynamics and productivity • more effective planning based on accurate forecasts of pasture and rangelands productivity variability. • improved global understanding of risk across all landscapes as climate and land use change through the addition of these lands into global agricultural monitoring. • RAPP – Rangeland and Pasture Productivity Monitoring • Action under Australian leadership (CSIRO) • 2nd Workshop (Paris, July 2014), 3rd workshop (Campinas, July 2015)Objectives: Develop community, identify pilot areas, identify key EO data sets, discuss interface global pasture monitoring system • 4th Workshop (Pretoria, June 2016) 15/XX
RAPP Product • Vegetation Cover Anomaly (Rangeland-Pastures) produced monthly & published on RAPP website & twitter accounthttp://www.geo-rapp.org/rapp-monitor/vegetation-cover-anomaly/ 16/XX
Challenge #1: Adaptation to Regional Agrosystems ex. Mixed crops – Rungbe, Tanzania Agroforestry systems based on : Crops: perennial (coffee, banana, cocoa, fruit trees, tea) & annual (corn, rice). Small fields : 300-1500 m². « CBM » : Coffee, Banana & Maize Trends Upper zone : CBM progressing, with gradual trimming of tea-cropping areas & Afromontane forest. Lower areas : CBM being abandoned in advantage of cocoa & rice monoculture, supported by significant investments (irrigation). C. LelongCIRAD 18 / 30
Challenge #2Gaps in Rainfall Station Reporting For one year, systematic sample on the 1st, 11th & 21st of month (3x12=36 samples) 1232 African GTS stations: 40% did not report on any of the 36 days of the sample only 25% sent all reports or missed only one Monitoring period: 1 to 15 October 2015 (percentage of reports received based on the main synoptic hours 0000, 0600, 1200 & 1800 UTC) 90% to 100% 45% to 90% 1% to 45% silent station GTS = Global Telecommunication System 19/XX
Challenges #3 Training – Capacity building Need to adjust Tools & Methods to local agrosystems Transfer Research Min. Agriculture Depts (Statistics, Food) Huge needs in Training / Capacity building in new User-countries (Learning engineering: Skills to be acquired, Pre-requisites, Online-presence.. TurnOver) Prerequisite. Dialog with stakeholders (needs time and expertise) Great funding needs GEO overall voluntary nature great, but institutionalizing require firm commitments (research, capacity building) Identification of new funds: an issue in many member countries 20/XX
Asia-RiCE – Asian Rice Monitoring A multi-national projectled by Japan (JAXA), with collaborations in ASEAN+3 countries & India A regional viewusing agro-meteorological data derived from low resolution optical satellite imagery (MODIS, GCOM-W, TRMM and others) A local view to estimate rice crop area and production using available radar and other satellite data with ground observation data and statistical information http://www.asia-rice.org 22/XX