Download
1 / 15
150 likes | 270 Views
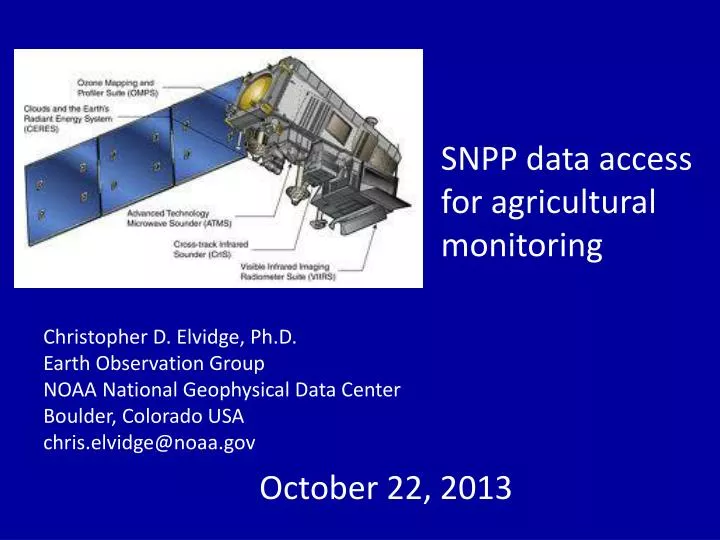
SNPP data access for agricultural monitoring. Christopher D. Elvidge , Ph.D. Earth Observation Group NOAA National Geophysical Data Center Boulder, Colorado USA c hris.elvidge@noaa.gov. October 22, 2013. SNPP is the USG’s 3 rd Generation Polar Orbiting Environmental Satellite .

E N D
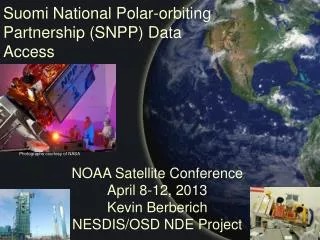
SNPP data access for agricultural monitoring Christopher D. Elvidge, Ph.D. Earth Observation Group NOAA National Geophysical Data Center Boulder, Colorado USA chris.elvidge@noaa.gov October 22, 2013
SNPP is the USG’s 3rd Generation Polar Orbiting Environmental Satellite The NASA/NOAA Suomi National Polar Partnership (SNPP) satellite was launched October 28, 2011. NGDC serves as one of two archives for SNPP data. The full stream of image data and products are received 6-8 hours from collection.
SNPP Data Flow Svalbard Ground Station NOAA NationalSatellite Operations Facility(NSOF), Suitland, MD Archive at National Geophysical Data Center Other Users National Weather Service
SNPP Environmental Products Rain Rate
Why SNPP Data From CLASS Are Difficult to Use • Few systems able to open HDF5 format. • Stacking of metadata balloons file sizes. • VIIRS data • Daytime data are “upside down”. • have latitude / longitude locations separate from image data (geolocation has not been performed). • VIIRS data and products have line deletions and redundant Earth features at edge of scan. The exception if the day/night band which has constant 742 meter pixels across full scan. • Regional study areas will be covered by multiple 5 minute aggregates and orbits.
Panoramic Bowtie Effect Nias Island, Sumatra Note the repetition of shoreline features
What Array Data Are Inside the HDF5? • Radiances or data values. These are often unsigned integers that must be multiplied by a coefficient to obtain the radiance or environmental data value (e.g. degrees K). • Solar zenith angle • Solar azimuth angle • Satellite zenith angle • Satellite azimuth angle • Satellite range (distance from pixel on ground to satellite) • Quality flag • Terrain corrected longitude • Terrain corrected latitude
NGDC Operates Regional Data Services to Improve Access to SNPP data • http://ngdc.noaa.gov/eog/viirs.html • East Asia (Japan and Korea) • Thailand (includes Myanmar, Vietnam, Laos, Cambodia) • Indonesia
Regional Data Services • NGDC identifies the data covering the service areaas they arrive for archiving • Coefficients are applied to obtain physical data values. • VIIRS data are projected into 15 arc second grids: north is up, line deletions are screened out, bowtie duplicates removed. • Output as geotiff. • Post for download.
Benefits • Data are: • Geolocated with terrain correction • Converted into physical units • In an easy to use geotiff format • Large data volume reductionachieved by eliminating metadata layers
Regional Data Service Vegetation Index Land Surface Temperature NDVI Land Cover Green vegetation fraction
Reduce the Download Data Volume and Increase the Number of Users! Raw imaging band data for two HDF5 aggregates = 4.5 GB. From NGDC service as geotiff = 225 MB. A 95% data volume reduction.