Download
1 / 1
10 likes | 76 Views
REGRESSION FIT. REGRESSION FIT. REGRESSION FIT. UNCERTAINTY LIMIT. UNCERTAINTY LIMIT. UNCERTAINTY LIMIT. Intercomparisons of Aura MLS, ACE, and HALOE Tracers using the LaRC Lagrangian Chemistry and Transport Model. LaRC.

E N D
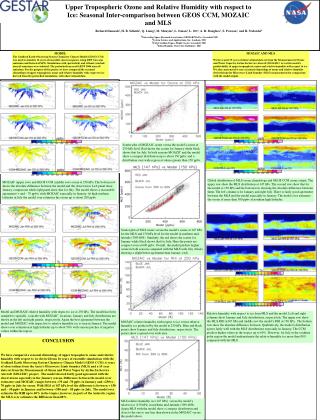
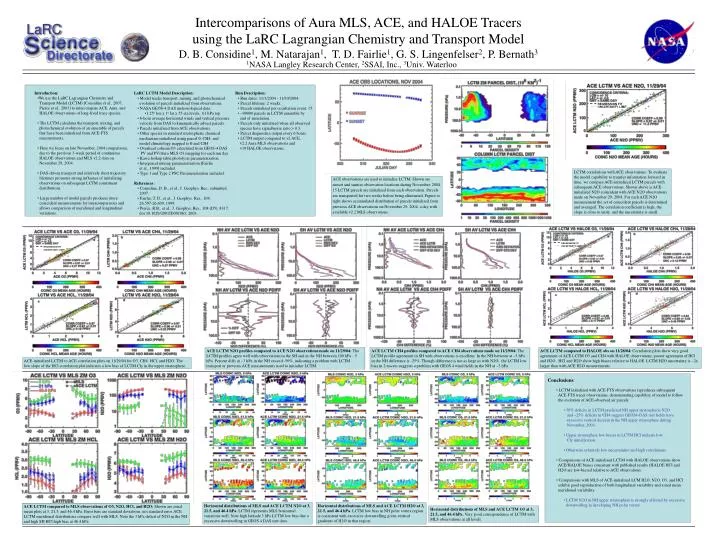
REGRESSION FIT REGRESSION FIT REGRESSION FIT UNCERTAINTY LIMIT UNCERTAINTY LIMIT UNCERTAINTY LIMIT Intercomparisons of Aura MLS, ACE, and HALOE Tracers using the LaRC Lagrangian Chemistry and Transport Model LaRC D. B. Considine1, M. Natarajan1, T. D. Fairlie1, G. S. Lingenfelser2, P. Bernath3 1NASA Langley Research Center, 2SSAI, Inc., 3Univ. Waterloo Introduction: LaRC LCTM Model Description: Run Description: • We use the LaRC Lagrangian Chemistry and • Transport Model (LCTM) [Considine et al., 2007; • Pierce et al., 2003] to intercompare ACE, Aura, and • HALOE observations of long-lived trace species. • The LCTM calculates the transport, mixing, and • photochemical evolution of an ensemble of parcels • that have been initialized from ACE-FTS • measurements. • Here we focus on late November, 2004 comparisons, • due to the previous 3-week period of continuous • HALOE observations and MLS v2.2 data on • November 29, 2004. • DAS-driven transport and relatively short trajectory • lifetimes promotes strong influence of initializing • observations on subsequent LCTM constituent • distributions. • Large number of model parcels produces more • coincident measurements for intercomparisons and • allows comparison of meridional and longitudinal • variations. • Model tracks transport, mixing, and photochemical • evolution of parcels initialized from observations. • NASA GEOS-4 DAS meteorological data: • 1.25o lon x 1o lat x 55 eta levels, .01 hPa top. • 6-hour average horizontal winds and vertical pressure • velocity from DAS to kinematically advect parcels. • Parcels initialized from ACE observations. • Other species in standard stratospheric chemical • mechanism initialized using parcel , CH4, and • model climatology mapped to and CH4 • Overhead column O3 calculated from GEOS-4 DAS • PV and PV/Aura MLS O3 mapping for each run day. • Kawa lookup table photolysis parameterization. • Interparcel mixing parameterization [Fairlie • et al., 1999] included. • Type 1 and Type 2 PSC Parameterization included. • Run dates: 11/1/2004 - 11/30/2004. • Parcel lifetime: 2 weeks. • Parcels initialized per occultation event: 15. • ~90000 parcels in LCTM ensemble by • end of simulation. • Parcels only initialized when all observed • species have signal/noise ratio > 0.3. • Parcel diagnostics output every 6 hours. • LCTM output compared to v2 ACE, • v2.2 Aura MLS observations and • v19 HALOE observations. LCTM correlations with ACE observations: To evaluate the model capability to transfer information forward in time, we compare ACE-initialized LCTM parcels with subsequent ACE observations. Shown above is ACE-initialized N2O coincident with ACE N2O observations made on November 29, 2004. For each ACE N2O measurement the set of coincident parcels is determined and averaged. The correlation coefficient is high, the slope is close to unity, and the uncertainty is small. ACE observations are used to initialize LCTM. Shown are sunset and sunrise observation locations during November, 2004. 15 LCTM parcels are initialized from each observation. Parcels are transported for two weeks before being eliminated. Figure to right shows accumulated distribution of parcels initialized from previous ACE observations on November 29, 2004, a day with available v2.2 MLS observations. References: • Considine, D. B., et al., J. Geophys. Res., submitted, • 2007. • Fairlie, T. D., et al., J. Geophys. Res., 104, • 26,597-26,609, 1999. • Pierce, R.B., et al., J. Geophys. Res., 108 (D5), 8317, • doi:10.1029/2001JD001063, 2003. ACE LCTM N2O profiles compared to ACE N2O observations made on 11/29/04: The LCTM profiles agree well with observations in the SH and in the NH between 100 hPa - 5 hPa. Percent diffs at ~3 hPa in the NH exceed -50%, indicating a problem with LCTM transport or previous ACE measurements used to initialize LCTM. ACE LCTM CH4 profiles compared to ACE CH4 observations made on 11/29/04: The LCTM profile agreement in SH with observations is excellent. In the NH between at ~3 hPa in the NH difference is -25%. Though difference is not as large as with N2O, the LCTM low bias in 2 tracers suggests a problem with GEOS 4 wind fields in the NH at ~3 hPa. ACE LCTM compared to HALOE obs on 11/28/04: Correlation plots show very good agreement of ACE LCTM O3 and CH4 with HALOE observations, poorer agreement of HCl and H2O. HCl and H2O show high biases relative to HALOE. LCTM H2O uncertainty is ~2x larger than with ACE H2O measurements. ACE-initialized LCTM vs ACE correlation plots on 11/29/04 for O3, CH4, HCl, and H2O. The low slope of the HCl correlation plot indicates a low bias of LCTM Cly in the upper stratosphere. Conclusions • LCTM initialized with ACE-FTS observations reproduces subsequent • ACE-FTS tracer observations, demonstrating capability of model to follow • the evolution of ACE-observed air parcels: • 50% deficits in LCTM-predicted NH upper stratospheric N2O • and ~25% deficits in CH4 suggest GEOS4-DAS met fields have • excessive vertical descent in the NH upper stratosphere during • November, 2004. • Upper stratosphere low biases in LCTM HCl indicate low • Cly initialization. • Otherwise relatively low uncertainties and high correlations. • Comparisons of ACE-initialized LCTM with HALOE observations show • ACE/HALOE biases consistent with published results (HALOE HCl and • H2O are low-biased relative to ACE observations. • Comparisons with MLS of ACE-initialized LCM H2O, N2O, O3, and HCl • exhibit good reproduction of both longitudinal variability and zonal mean • meridional variability. • LCTM N2O in NH upper stratosphere is strongly affected by excessive • downwelling in developing NH polar vortex. Horizontal distributions of MLS and ACE LCTM N2O at 3, 21.5, and 46.4 hPa. LCTM represents MLS horizontal variations well. Note high latitude 3 hPa LCTM low bias due o excessive downwelling in GEOS 4 DAS met data. Horizontal distributions of MLS and ACE LCTM H2O at 3, 21.5, and 46.4 hPa. LCTM low bias in NH polar vortex region is consistent with excessive downwelling given vertical gradients of H2O in that region. ACE LCTM compared to MLS observations of O3, N2O, HCl, and H2O: Shown are zonal mean plots at 3, 21.5, and 46.4 hPa. Error bars are standard deviations, not standard error. ACE LCTM meridional distributions compare well with MLS. Note the 3 hPa deficit of N2O in the NH and high SH HCl high bias at 46.4 hPa. Horizontal distributions of MLS and ACE LCTM O3 at 3, 21.5, and 46.4 hPa. Very good correspondence of LCTM with MLS observations at all levels.