Download
1 / 14
140 likes | 255 Views
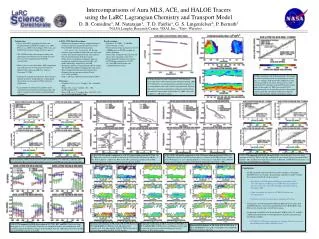
EOS-Aura MLS Validation Using Radiosonde Profiles During the WAVES Campaign. Cassie Stearns August 10,2006 Dr. Bojan Bojkov and Dr. David Whiteman, Advisors. WAVES campaign, Howard University Research Campus, Beltsville MD. Inter-instrumental Aqua/Aura Validation Campaign

E N D
EOS-Aura MLS Validation Using Radiosonde Profiles During the WAVES Campaign Cassie Stearns August 10,2006 Dr. Bojan Bojkov and Dr. David Whiteman, Advisors
WAVES campaign, Howard University Research Campus, Beltsville MD Inter-instrumental Aqua/Aura Validation Campaign with 2 major ground components: • Meteorological balloon with: • Vaisala RS-92 and RS-80, ATM, Intermet, and MODEM for PTU • Electrochemical cell (ECC) ozonesondes • Cryogenic frost point hygrometer (CFH) for water vapor. • 4 LIDAR systems for aerosols and 3 for water vapor
Weather Balloon with RS-92 CFH/ECC ATM Intermet RS-92
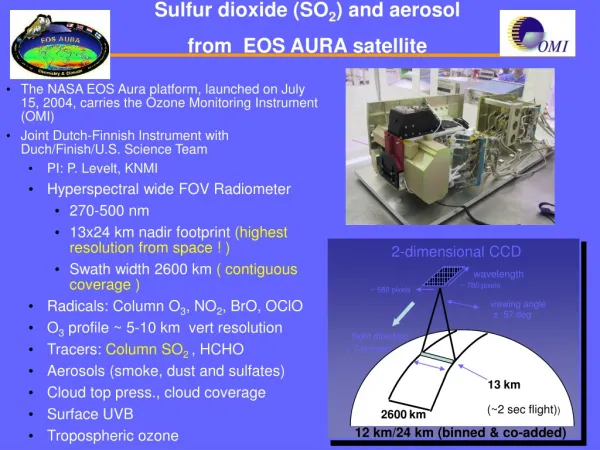
The Aura MLS (Microwave Limb Sounder) Instrument 705 km orbit height • 20 second vertical scan (every ~1.5˚), 7 min ahead • 5 spectral regions: 118,190,240,640,GHz; 2.5 THz • Scan Values averaged and reported at 37 pressure levels
MLS-sonde T differences (preliminary) Few points 10 hPa High variability 146 hPa 215 hPa
MLS-sonde ozone differences (preliminary) Few Points/Mechanical Uncertainty 10 hPa 146 hPa High variability
Conclusions • The MLS profiles are in good agreement with the WAVES soundings, within uncertainty • Measurements are within error estimates specified in MLS documentation, including the temperature warm biases • 210 and 146 hPa levels are heavily variable due to tropopause variation, and may fall outside expected error. • 10 hPa level data contains fewer points of the RS-92 profile, and should be weighted less heavily; with the O3 sonde, there is also mechanical error introduced at low pressure. • Ongoing work: • Complete analysis to completed shortly (campaign is ongoing) • Aura HIRDLS and TES products to be investigated also
A Special Thanks to: • Dr. Bojan Bojkov, and Dr. David Whiteman, my advisors • Dr. Everett Joseph, Dr. Demetrius Venable, and the Howard University Beltsville crew • My fellow RS-92 radiosonde launchers: Eduardo, Ani, Scott, and Pat; and everyone else helping with WAVES! • UNH/GSFC Research and Discover Program