Download
1 / 27
270 likes | 394 Views
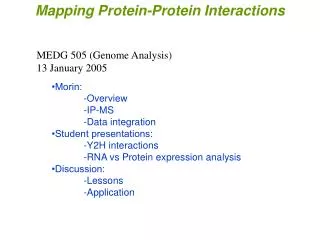
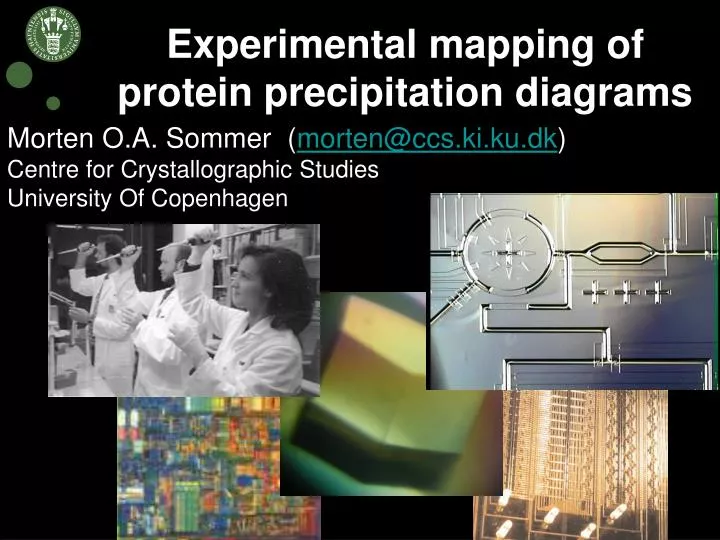
Experimental mapping of protein precipitation diagrams. Morten O.A. Sommer ( morten@ccs.ki.ku.dk ) Centre for Crystallographic Studies University Of Copenhagen. Look at protein crystallography and liquid handling.

E N D
Experimental mapping of protein precipitation diagrams Morten O.A. Sommer (morten@ccs.ki.ku.dk) Centre for Crystallographic Studies University Of Copenhagen
Look at protein crystallography and liquid handling Low volume liquid handling technology more experiments performed using less SAMPLE Lab automation more experiments performed using less TIME Low TIME and SAMPLE consumption enables new approaches to protein crystallization
Microfluidic formulator technology 1 mm Experiments done by: Carl Hansen, Morten Sommer and Stephen Quake. PNAS (2004) 101:14431-14436
Motor oil (SAE 20) at 20 degrees C RawLinseed oil 20 degrees C Water at 20 degrees C Injection volume: 80 pL +/- 0.6 pL Metering accurate and robust Metering accuracy determined by absorption measurements Experiments done by: Carl Hansen, Morten Sommer and Stephen Quake. PNAS (2004) 101:14431-14436
Ideal approach to protein crystallization • GOAL: Further rationalization of protein crystallization • Using minute amounts of protein sample to quantify: • Protein stability, folding & activity • Protein physical chemistry (solubility and precipitation limits) • Protein - protein interactions (Virial coefficients etc.)
Why use precipitation diagrams? Phase diagram of: aspartyl-tRNA synthetase-1 From Thermus thermophilus Zhu et. al. 2001 Acta Cryst. D 57:552-558
Towards a rational approach: Tailor made screens based on precipitation diagrams • Characterize protein solution and identify potential conditions • Map protein precipitation diagrams • Design and set up a tailor made crystallization screen based on the precipitation diagrams of the particular protein
Initial validation: Xylanase • Make solubility fingerprint identifying precipitating chemical conditions • Map precipitation diagrams for potential conditions • Set up crystallization experiments near precipitation boundary Experiments done by: Carl Hansen, Morten Sommer and Stephen Quake. PNAS (2004) 101:14431-14436
Initial validation: Xylanase Crystallization probability pr. trial OPT (Tailor made screen): 27 hits out of 48 experiments = 56 % Sparse matrix screens: 3 hits out of 384 experiments = 0.8 % Experiments done by: Carl Hansen, Morten Sommer and Stephen Quake. PNAS (2004) 101:14431-14436
Further validation Membrane protein: SERCA • Study the crystallization of membrane proteins using the previously crystallized calcium pump (SERCA) • Crystallization conditions are know • Reliable preparation and purification Sørensen et.al., (2004) Science304, 1672-1675
Further validation Membrane protein: SERCA • Solubility fingerprint can be used to identify specific protein – precipitant interactions • Identification of specific interaction between sodium acetate and SERCA • Sodium acetate is an established crystallization agent for SERCA Experiments done by: Morten Sommer and Sine Larsen. Journ. of Synchrotron Rad. (2005) in press
Further validation Membrane protein: SERCA • Based on the characterization of specific protein – precipitant interactions several chemical conditions were selected for precipitation diagram mapping • Set up tailor made crystallization screen • Identification of well known and new crystallization agents • Potentially useful for crystallizing previously uncrystallized membrane proteins Experiments done by: Morten Sommer and Sine Larsen. Journ. of Synchrotron Rad. (2005) in press
Process diagram Analysis of protein-precipitant interaction Solubility fingerprint Protein sample Precipitation diagrams Formulator chip Crystals Design rational crystallization experiments Monitor experiments Setup crystallization experiments
Task Volume consumption (μL) Solubility characterization 10 Setup of 300 crystallization exp. 25 TOTAL 35 Perspectives Rational approach to protein crystallization using minute sample volumes Rational approaches are possible for many targets that are available in low amounts (Membrane proteins, protein complexes, and proteins purified from native tissue).
Testing previously uncrystallized membrane proteins The ultimate test of the rational approach: 3 previously uncrystallized membrane proteins are tested. 1. Voltage gated channel 2. DsbB: disulfide bond forming membrane protein. 3. AIDA: adhesin autotransporter protein
Voltage-gated channel:Solubility mapping Based on the solubility fingerprint 40 precipitation diagrams are mapped out. Volume consumption pr. precipitation diagram: 100 nL Total consumption for solubility screen and precipitation diagrams: 8 μL (44.8 μg) Experiments done by: Morten Sommer, Jens-Christian Navarro Poulsen, Sine Larsen, Jose Santos and Mauricio Montal
Voltage-gated channel:Crystallization experiments A tailor made screen of 288 conditions is designed. The screen is set up as sitting drop exp. using an ORYX 6 at Douglas Instruments using 17 μL sample (95 μg of protein) An additional screen is set up testing different additives Experiments done by: Morten Sommer, Jens-Christian Navarro Poulsen, Sine Larsen, Jose Santos and Mauricio Montal
Voltage-gated channel:Crystallization experiments Crystals tested at ESRF beamline ID 29. Scalebars = 100 microns Not protein crystals Experiments done by: Morten Sommer, Jens-Christian Navarro Poulsen, Sine Larsen, Jose Santos and Mauricio Montal
DsbB:Solubility mapping 40 chemical conditions are chosen for determination of their precipitation diagram. Using a total of 4 μL (40 μg of protein). A tailor made screen consisting of 288 conditions was designed and set up using 18 uL (180 μg) Experiments done by: Morten Sommer, Jens-Christian Navarro Poulsen, Sine Larsen, Brian Vad and Daniel Otzen
DsbB:Crystallization experiments Crystals tested at ESRF ID 29 Scalebars = 100 microns Some were not protein. Some did not diffract cryo optimization Experiments done by: Morten Sommer, Jens-Christian Navarro Poulsen, Sine Larsen, Brian Vad and Daniel Otzen
AIDA:Solubility characterization 40 precipitation diagrams are selected for mapping based on solubility fingerprint Based on the diagrams a 576 experiment screen is designed and set up Volume consumption: Solubility mapping: 8 μL Crystallization exp.: 22 μL Experiments done by: Morten Sommer, Jens-Christian Navarro Poulsen, Sine Larsen, Brian Vad and Daniel Otzen
AIDA:Crystallization experiments Some did not diffract optimize cryo conditions Crystals tested at ESRF ID 29 Scalebars = 100 microns Experiments done by: Morten Sommer, Jens-Christian Navarro Poulsen, Sine Larsen, Brian Vad and Daniel Otzen
Summarizing remarks • As liquid handling technologies have achieved ~1 nL experimental volumes. • A rationalization of protein crystallization in terms of precipitation diagrams is possible • Rational approaches to protein crystallization are performed using < 300 μg of protein sample. • Hope: This method and technology will allow for a better understanding of the crystallization process - and that complementary low volume technology will be developed to address other aspects of protein crystallization
Univ. Of Copenhagen Jens-Christian Poulsen Prof. Sine Larsen Flemming Hansen Centre for Crystallographic Studies Univ. Of Aalborg Prof. Daniel Otzen Brian Vad Univ. Of Aarhus Ass. Prof. Poul Nissen Prof. Jesper Vuust Møller Tech. Univ. Of Denmark Ass. Prof. Jörg Kutter Detlef Snakenborg Stanford Prof. Stephen R. Quake Univ. Of British Columbia Ass. Prof. Carl L. Hansen Univ. of California – San Diego Prof. Mauricio Montal Dr. Jose Santos Douglas Instruments James Smith Peter Baldock Patrick Shaw Stewart ESRF – ID29 Gordon Leonard Acknowledgements
Experimental mapping of protein precipitation diagrams Morten O.A. Sommer (morten@ccs.ki.ku.dk) Centre for Crystallographic Studies Univ. Of Copenhagen