Download
1 / 15
150 likes | 263 Views
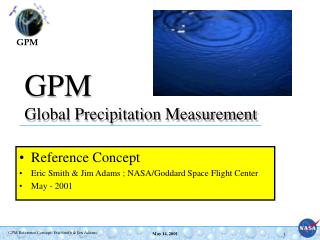
OUTLINE. Physical issues 183-GHz images 54-GHz T B images AMSU (NOAA-15) retrievals vs. NEXRAD 183-GHz optional instruments vs. NEXRAD. GLOBAL PRECIPITATION MAPPING USING OPAQUE MICROWAVE BANDS. Presented August 30, 2001, to GPM Workshop NASA Goddard Space Flight Center

E N D
OUTLINE • Physical issues • 183-GHz images • 54-GHz TB images • AMSU (NOAA-15) retrievals vs. NEXRAD • 183-GHz optional instruments vs. NEXRAD GLOBAL PRECIPITATION MAPPING USING OPAQUE MICROWAVE BANDS Presented August 30, 2001, to GPM Workshop NASA Goddard Space Flight Center Greenbelt, Maryland Presented by Prof. David H. Staelin <staelin@mit.edu> Frederick W. Chen <fwchen@mesa.mit.edu> Massachusetts Institute of Technology
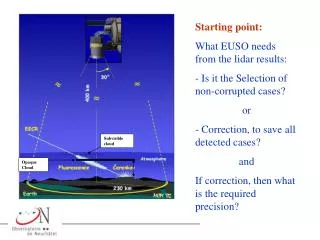
Use of 183-GHz Water Vapor Band • Precipitation rate (kg/m2s) is proportional to absolute humidity (kg/m3) times vertical velocity (m/s) • Absolute humidity profile of the atmosphere is retrievable from 54 and 183-GHz bands because: • Temperature profiles are retrievable from the 54-GHz spectrum • Opaque frequencies near 183-GHz H2O resonance sense temperatures near (water vapor) =1 • TB (penetration depth) at = 1 (183 GHz) reveals humidity profile for near-adiabatic atmospheres • Vertical wind velocities are greater where TBmin() – TB is greater because: • Saturated clear adiabatic atmospheres yield minimum brightness temperatures TBmin() • TB < TBmin implies precipitation because only hydrometeors scatter/emit colder temperatures • Larger values of TBmin – TB imply more and larger hydrometeors aloft • More and larger hydrometeors aloft imply higher vertical velocities • Also, at 183±3 and 183±1 GHz only the highest hydrometeors (vertical winds) are evident • Therefore precipitation rate can be inferred from TBmin( 183 GHz) and TB if () 1 near cell tops • Which frequency yields 1 near cell tops depends on local surface temperatures and cell altitude Physical Links Between Precipitation Rate and Microwave Sounding Channel Responses – (1)
Use of Opaque Oxygen Band Channels Near 54- and 118-GHz Resonances • Spectra of radiance perturbations caused by cell tops reveal precipitation rate because: • Cell-top (cold spot) visibility as f() (penetration depth) yields cell-top altitude information • More intense rain cells typically penetrate to higher altitudes due to greater vertical velocities • Higher vertical wind velocities imply higher precipitation rates • Relative scattering (cold) signatures near 54 and 118 GHz reveal precipitation rate because: • 54-GHz approaches low TB’s of 118-GHz band only for larger scattering particles (>~1mm) • Larger scattering particles aloft imply larger vertical wind velocities • Absolute scattering (cold) signature near 54 and 118 GHz reveal precipitation rate because: • Lower brightnesses imply more ice particles and higher vertical velocities and precipitation rates Physical Links Between Precipitation Rate and Microwave Sounding Channel Responses – (2)
AMSU/NEXRAD 15-km Rain Rate Retrieval RMS Differences (mm/hr) NOAA-15, 21 orbits, October 1999 – October 2000 4704 precipitating pixels not used in training were analyzed
AMSU/NEXRAD 50-km Rain Rate Retrieval RMS Differences (mm/hr) NOAA-15, 21 orbits, October 1999 – October 2000 3229 precipitating pixels were analyzed