Download
1 / 4
40 likes | 191 Views
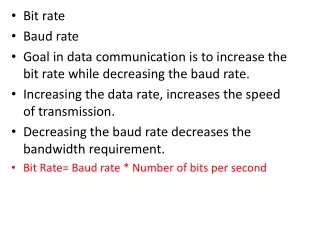
14. 14. B. A. 12. 12. 10. 10. 8. 8. Oxygen uptake ( μ mol min -1 g -1 DW). Oxygen uptake ( μ mol min -1 g -1 DW). 6. 6. 4. 4. 2. 2. 0. 0. cells + Rot. 48h MeOH. 48h MeOH + rot. 48h Rot. 48h Rot + rot. No addition. cells + MeOH. Supplemental Figure S1.

E N D
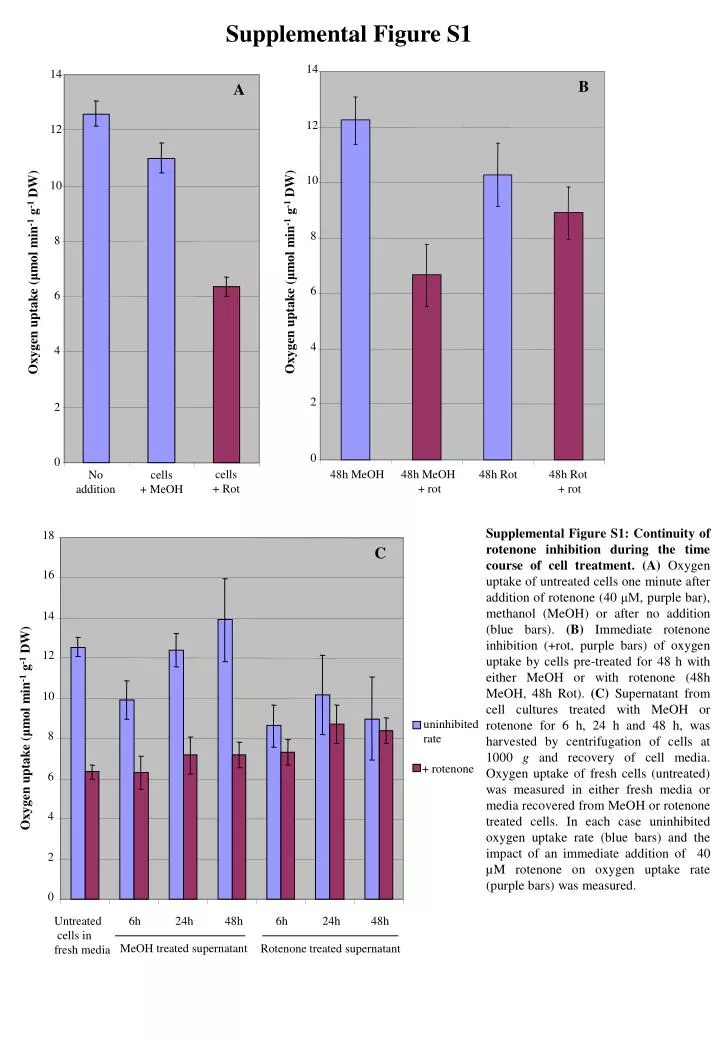
14 14 B A 12 12 10 10 8 8 Oxygen uptake (μmol min-1 g-1 DW) Oxygen uptake (μmol min-1 g-1 DW) 6 6 4 4 2 2 0 0 cells + Rot 48h MeOH 48h MeOH + rot 48h Rot 48h Rot + rot No addition cells + MeOH Supplemental Figure S1 Supplemental Figure S1: Continuity of rotenone inhibition during the time course of cell treatment.(A) Oxygen uptake of untreated cells one minute after addition of rotenone (40 μM, purple bar), methanol (MeOH) or after no addition (blue bars). (B) Immediate rotenone inhibition (+rot, purple bars) of oxygen uptake by cells pre-treated for 48 h with either MeOH or with rotenone (48h MeOH, 48h Rot). (C) Supernatant from cell cultures treated with MeOH or rotenone for 6 h, 24 h and 48 h, was harvested by centrifugation of cells at 1000 g and recovery of cell media. Oxygen uptake of fresh cells (untreated) was measured in either fresh media or media recovered from MeOH or rotenone treated cells. In each case uninhibited oxygen uptake rate (blue bars) and the impact of an immediate addition of 40 µM rotenone on oxygen uptake rate (purple bars) was measured. 18 C 16 14 12 10 Oxygen uptake (μmol min-1 g-1 DW) uninhibited rate 8 + rotenone 6 4 2 0 Untreated cells in fresh media 6h 24h 48h 6h 24h 48h MeOH treated supernatant Rotenone treated supernatant
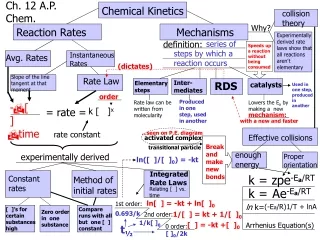
Supplemental Figure S2. A B Whole Cell Respiration, 16h Rotenone (16 h) 12 Control Rotenone Control 8 I2+III4 mmol O2 / min/ g DW 3000 kDa 4 1500 I1+III2 1000 0 I Total COX AOX Total COX AOX C V Mitochondrial Respiration, succ/ATP, 16h 500 III2 300 200 IV b nmol O2 / min/ mg prot a II 150 100 0 succ/ATP +ADP +myxo +DTT/pyr +nPG D Mitochondrial Respiration, malate/glutamate, 16h 300 200 nmol O2 / min/ mg prot 100 0 malate/glu +ADP +rotenone +nPG Supplemental Figure S2. Analysis of respiratory rates of whole cells and isolated mitochondria and analysis of mitochondrial OxPhos complexes by BN-PAGE after rotenone treatment.
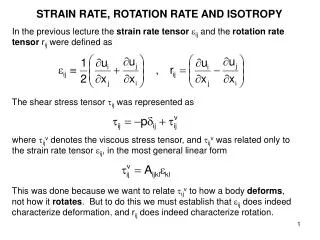
Supplemental Figure S2. Analysis of respiratory rates of whole cells and isolated mitochondria and analysis of mitochondrial OxPhos complexes by BN-PAGE after rotenone treatment. (A) Oxygen uptake measurements of whole cell suspension (aliquots of 300 μL in the 1 mL reaction chamber), 16 h after treatment with methanol (0.25% v/v, control) or 40 μM rotenone. Respiration rates were measured at 22°C with a Clark oxygen electrode as described in Materials and Methods. Total respiration was determined in presence of CCCP, COX and AOX respirations in presence of nPG and KCN respectively. Values are the means ±SE from at least 10 independent experiments. AOX capacity is significantly increased by rotenone treatment at p<0.05. (B) BN-PAGE was performed on 500 µg of proteins from mitochondria isolated from cells, 16 h after treatment with methanol (0.25% v/v, control) or 40 µM rotenone. NADH dehydrogenase activity was detected as dark-blue color bands after incubation of gels in nitro blue tetrazolium reaction medium. Identities of the separated protein complexes and supercomplexes are given on the left : I, II and IV, complex I, II and IV respectively; III2, dimeric form of complex III, I2+III4, supercomplex consisting of two copies of complex I and two copies of dimeric complex III; I1+III2, supercomplex consisting of one copy of complex I and one copies of dimeric complex III. Molecular weight scale is indicated on the left. Two independent experiments were performed. (C, D) Oxygen uptake measurements of mitochondria isolated from cell suspensions, 16 h after treatment with methanol (white histograms) or 40 μM rotenone (black histograms). Respiration rates were recorded at 25°C on 200 μg of mitochondrial proteins with a Clark oxygen electrode as described in Materials and Methods. Added substrates, co-factors and inhibitors are indicated under each x-axis. Values are the means ±SE from at least 5 independent experiments. Statistically different values between methanol and rotenone treatments are indicated by different letters (level of significance: a, p<0.01; b: p<0.05).
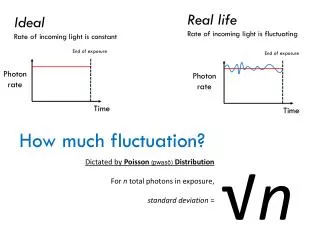
ccb203 ccb206 ccb256 ccb382 ccb452 nad4L atp6-1 atp6-2 nad2b rpL16 nad2a rpsL2 matR n18S nad1 nad3 nad4 nad5 nad6 nad7 nad9 cox1 cox2 cox3 rpL2 rpL5 atpB orfX rpS3 rpS7 atp8 atp1 atp9 rps4 26S 18S cob 1.5 3h 12h 1 Change in transcript abundacne log2(Rot//control) 0.5 0 -0.5 -1 Supplemental Figure S3. Supplemental Figure S3.Transcriptional response of mitochondria-encoded genes for mitochondrial components following rotenone treatment. Total RNA were extracted from cells at 3 and 12h after treatment with methanol (0.25% v/v) or 40µM rotenone in methanol (0.25% v/v). Mitochondrial encoded transcripts for components of the Complex I were measured by RT-qPCR at 3 h (blue histograms) or 12 h (red histograms). Log2(Rot/control) is the log base 2 value of the ratio of the transcript abundances in the rotenone-treated sample over the corresponding methanol control sample. The errors bars correspond to the standard errors calculated from 3 biological replicates.


![Download Book [PDF] The Boudoir Bible: The Uninhibited Sex Guide for Today](https://cdn7.slideserve.com/12546021/slide1-dt.jpg)