Download
1 / 30
300 likes | 430 Views
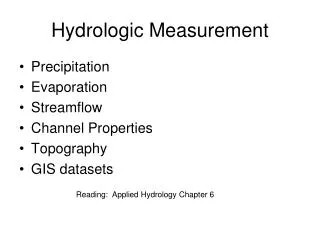
ENVI 412 Hydrologic Losses and Radar Measurement. Dr. Philip B. Bedient Rice University. Lake Energy Budget. Q e = energy used for evaporation Q h = sensible heat Q q = stored energy Q v = advected energy Q N = net radiation absorbed by water body. Lake Evaporation.

E N D
ENVI 412Hydrologic Losses and Radar Measurement Dr. Philip B. Bedient Rice University
Lake Energy Budget • Qe = energy used for evaporation • Qh = sensible heat • Qq = stored energy • Qv = advected energy • QN = net radiation absorbed by water body
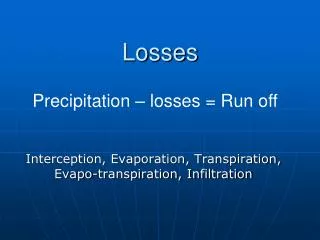
Lake Evaporation • Function of wind speed, T, and humidity gradient • Energy source - solar energy • Mass transfer, energy budget, and pan evaporation • Penman’s combined (1948)
Mass Transfer E = es - ea (a + bu) Where E = evaporation (cm/day) es = Sat vapor pressure (T) ea = Vapor pres at fixed z u = wind speed in m/sec a,b = constants
Evaporation Pans • Anemometer - wind • Rain Gage - precip. • Pan for water - evap • Level measured daily • Refilled as necessary
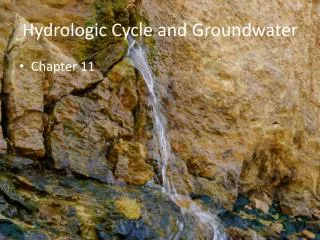
Soil Moisture Cycle • Autumn - rainfall recharge • Winter - max soil storage • Spring - some evap loss • Summer - most depleted
Horton’s Infiltration Concept f(t) = Rate of water loss into soil f = fc + (fo - fc) exp (-kt) fc = final rate value fo =initial rate value K = decay rate Can integrate to get F(t) = Vol of infiltration
index Method • Assumes constant rate over time of rainfall • Volume above line is DRO • Volume below line is F(t) • Trial and error computed
Example of F Index DRO VOL Infiltration F(t)
Example of F Index Assume 4.9 in of DRO from a 560 acre Basin Set up a general Eqn forF index 2(1.4 - F) + 3(2.3- F) +2(1.1- F) +3(0.7- F) + 2(0.3- F) = 4.9 Find Fby trial and error by assuming a value and solving - try F = 1.5 in/hr And it only accounts for 2.4 in of DRO F = 0.5 in/hr yields 9.0 in of DRO - too much DRO Try F =1.0 in/hr or 2(.4) +3(1.3)+2(.1) = 4.9 inches
Stream Cross-Section for Q • Measure v at 0.2 and 0.8 of depth • Average v and multiply by DW*D • Sum up across stream to get total Q
Typical Rating Curve for Stream • Plot of z vs. Q • Determined from stream measurements of V • Unique for each stream • Changes with development • Available for all USGS gages
Standard Flood Alert System Use measured rainfall Predict hydrologic Response in x,y, and t Alert various agencies and emergency mgrs Save lives and damages
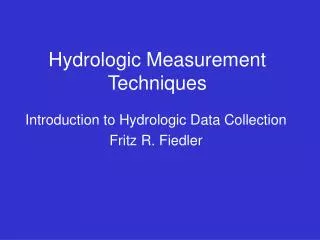
Use of NEXRAD Rainfall for Hydrologic Prediction Dr. Baxter Vieux, University of Oklahoma National Severe Storm Laboratory
NEXRAD Radar Data • Recent Innovation • Uses radar - NWS • DPA every 5 minutes • Accurate to 230 km • Provides better spatial detail than gages
Radar Provides Visual Effects Midnight 1 a.m.
Radar–Gage Calibration October 17, 1994 Sims Bayou Total Rainfall Radar (in.) Brays Bayou Total Rainfall measured at the Gage (in.)
October, 1994 Calibration Cumulative Rainfall (in.)
Weather Radar Systems • Recently deployed weather radar systems such as NEXRAD offer accurate and reliable precipitation estimation • Increased sensitivity coupled with improved processing provides high-resolution radar data sets for a variety of applications. • Provides another source of rainfall information in addition to rain gauges
WSR-88D - NEXRAD • The first operational WSR-88D was installed in May 1990 at Twin Lakes, OK • 160 + deployed nationwide and overseas. • Is now being used for much more than weather forecasts. • Most significant advancement in hydrology in last 20 years!
Users of Radar and Meteorological Data • Real-time access to radar and other meteorological data is now provided to users outside of the NWS • Nexrad has spawned a private sector meteorological services industry • Now other users are beginning to experience the benefits within the hydrologic community
Prospects for Flood Modeling in Real-Time • Forecasting urban streams that respond rapidly to heavy rainfall is difficult. • Such forecasts can easily underpredict the river stage with little or no lead time • Why have hydrologic models lagged the development of radar technology and meteorological science? • How can we improve current hydrologic practice in order to forecast flood levels in real-time?