Download
1 / 32
330 likes | 977 Views
Calculating Factorial ANOVA. The basic logic of a Factorial ANOVA (e.g. 2x2 ANOVA) is the same as the One-way ANOVA. You calculate an F-ratio and this represents the contrast of Between Groups variance / Within Subjects variance.

E N D
Calculating Factorial ANOVA • The basic logic of a Factorial ANOVA (e.g. 2x2 ANOVA) is the same as the One-way ANOVA. • You calculate an F-ratio and this represents the contrast of Between Groups variance / Within Subjects variance. • If the F ratio is sufficiently high, then at least one mean is significantly different from at least one other mean.
Calculating Factorial ANOVA F=Between Groups variance / Within Subjects variance. If the F ratio is sufficiently high, then at least one mean is significantly different from at least one other mean.
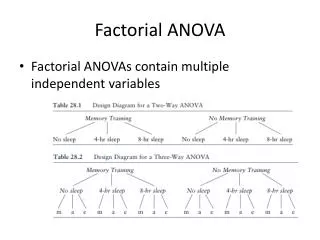
Calculating Factorial ANOVA There are 3 F ratios for Two-way ANOVA: F for the column main effect F for the row main effect F for the Interaction (Row x Column)
Calculating Factorial ANOVA There are 3 F ratios for Two-way ANOVA: F for the column main effect F for the row main effect F for the Interaction (Row x Column)
Calculating Factorial ANOVA There are 3 F ratios for Two-way ANOVA: F for the column main effect
Calculating Factorial ANOVA There are 3 F ratios for Two-way ANOVA: F for the column main effect
Calculating Factorial ANOVA There are 3 F ratios for Two-way ANOVA: F for the row main effect
Calculating Factorial ANOVA There are 3 F ratios for Two-way ANOVA: F for the row main effect
Calculating Factorial ANOVA There are 3 F ratios for Two-way ANOVA: F for the interaction
Calculating Factorial ANOVA The Within Group Variance for these F ratios is calculated from the variability within each respective set of cells.
Calculating Factorial ANOVA The Grand Mean (GM): The mean of all your scores. The deviation of an individual score from the GM is composed of the following: 1. The score’s deviation from the mean of its cell (Within Group variance) 2. The score’s row mean from the grand mean (Row Between Group variance) 3. The score’s column mean from the grand mean (Column Between Group variance) 4. After you subtract the (Within+Row+Column) from the total variance, you are left with the Interaction Between Group variance
Factorial ANOVA Example A researcher was interested in men’s and women’s ability to navigate using two different kinds of directions: maps versus routes. Navigation ability was measured by the time to reach the destination (in minutes). At the p < .05 level, were there any main effects or an interaction?
Steps of Hypothesis Testing • Step 1: Restate research question Main effect of gender • H0: men = women • H1: menwomen Main effect of direction type • H0: route = map • H1: routemap Interaction of gender and direction type • H0: men,route - women,route = men,map - women,map • H1: men,route - women,route men,map - women,map
Steps of Hypothesis Testing • Step 2: Determine the comparison distribution • Three F distributions • dfwithin = dfeach cell = 3 + 3 + 3 + 3 = 12 • dfgender = Ngenders – 1 = 2 – 1 = 1 • dfdirection type = Ndirection types – 1 = 2 – 1 = 1 • dfinteraction = Ncells – dfgender – dfdirection type – 1 = 4 – 1 – 1 – 1 = 1 • Step 3: Determine the cutoffs • p < .05 • F ratio with dfnumerator = 1, dfdenominator = 12 • Fcutoff = 4.75
Steps of Hypothesis Testing • Step 4: Determine the sample scores • Download the excel spreadsheet Gender & Directions Review the findings. • Download the file genderdir.sav. Run the same analysis with SPSS
Steps of Hypothesis Testing • Step 5: Conclude • There was no main effect of gender • On average, men and women took the same amount of time to navigate • There was a main effect of direction type • Map directions took longer to follow compared with route directions • There was an interaction between gender and direction type • The difference in direction type was smaller for men compared to women • Men were faster than women with map directions, but women were faster than men with route directions
Assumptions of Two-Way ANOVA • Populations follow a normal curve • Populations have equal variances • Assumptions apply to the populations that correspond to each cell
Effect Size and Two-Way ANOVA R2The proportion of variance accounted for also called eta squared or correlation ratio This is the proportion of the total variation of scores from the Grand Mean that is accounted for by the variation between the means of the groups. R2Columns= SSColumns /(SSTOTAL-SSRows-SSInteraction) R2Rows= SSRows / (SSTOTAL -SSColumns-SSInteraction) R2Interaction=SSInteraction /(SSTOTAL-SSRows-SSColumns) Small = .01; Medium = .06; Large = .14 Compute this for the Gender x Directions Study
Power and Two-Way ANOVA Probability of finding an effect when it is present. All effects in a 2x2 table: <Graph these in Excel>
Sample Size and Factorial ANOVA Sample size needed for 80% power, Using a 2x2 or 2x3 ANOVA, p < .05. <Graph these in Excel>
Sample Size and Factorial ANOVA Use SPSS to analyze the Gender x Directions study. Include Options such that SPSS generates the effect size and power for the analysis. How large are the effects? Double the sample size and examine what happens to the power calculation. Do power and effect size change? Run correlations between the variables and compare the Pearson r to the effect size.
Complex Factorial ANOVA Multiple Levels of Factors A study can have as many contrasts as there are variables A study can have multiple dependent measures A study can have repeated measures 2x2x2 2x4x8x2x4
Complex Factorial ANOVA Multiple Levels of Factors A study can have as many contrasts as there are variables Let’s do a complex analysis with 3 factors Download salary.sav Analyze Gender, Education and Job Category, dependent measure is current salary. Run the basic analysis first and then set Options for effect size and power calculations.
Complex Factorial ANOVA Dichotomizing Numerical Variables A common practice is to simplify an analysis by dichotomizing or categorizing a continuous variable and then using the variable as a factor in ANOVA. This results in reduced information and lower power. When the resolution of measurement is lowered then it is harder to find a significant effect when it is present. Categorizing variables also lowers the effect size. Calculate correlations with salary.sav data set. Categorize the work experience variable and observe the change in correlations.
Complex Factorial ANOVA Repeated Measures ANOVA ANOVA may also be used to examine a within-subjects factor. This factor represents another variable measured on the same subjects. The measures are therefore correlated, or dependent on each other. The repeated measures ANOVA is logically the same as the paired, or dependent measures t-test. Examples Single Factor:Change in illness before and after treatment Multiple Factor: Do Males and Females differ in change in illness before and after treatment Gender x PrePost Change
Repeated Measures Factorial ANOVA Traumatic Brain Injury
Repeated Measures Factorial ANOVA Traumatic Brain Injury Pathology Direct Impact Shearing Injury Hematoma Increased Intracranial Pressure Disruption of Neurotransmitter Systems <Play Stone in Head movie>
Repeated Measures Factorial ANOVA Coma Level: 0 = Unresponsive 1 = Responds only to pain 2 = Responds to pain and verbal command with nonspecific response 3 = Responds to pain or verbal command with meaningful response 4 = Somnolent (falls asleep) 5 = Awake and alert Traumatic Brain Injury
Cycloserine for Traumatic Brain Injury The NMDA receptor may be important for memory. Cycloserine facilitates NMDA receptor function
Cycloserine for Traumatic Brain Injury Repeated Measures ANOVA: Basic Study Design Dependant Measure: Memory Scores Independent Variables: Treatment/Control, Coma Level Repeated Measures: Pre and Post Drug Treatment Analyze the data set trauma.sav Analyze Main effects of Independent Variables and dependent w/o repeated measures. Analyze Treatment/Control x PrePost repeated measures. -> Plot results Analyze Coma Level x PrePost repeated measures -> Plot results Calculate an average of Pre+Post/2 and then analyze the new variable for a main effect for Coma Level.