Download
1 / 26
270 likes | 641 Views
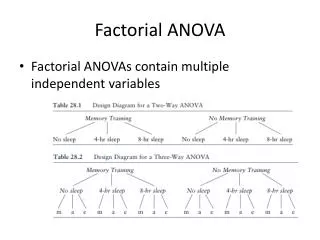
One-Way and Factorial ANOVA. SPSS Lab #3. One-Way ANOVA. Two ways to run a one-way ANOVA Analyze Compare Means One-Way ANOVA Use if you have multiple DV’s, but only one IV Analyze General Linear Model Univariate Use if you have only one DV bc/ can provide effect size statistics

E N D
One-Way and Factorial ANOVA SPSS Lab #3
One-Way ANOVA • Two ways to run a one-way ANOVA • Analyze Compare Means One-Way ANOVA • Use if you have multiple DV’s, but only one IV • Analyze General Linear Model Univariate • Use if you have only one DV bc/ can provide effect size statistics • More on this later (factorial ANOVA section)
Method #1: Compare Means • First we have to test if we meet the assumptions of ANOVA: • Independence of Observations • Cannot be tested statistically, is determined by research methodology only • Normally Distributed Data • Shapiro-Wilk’s W statistic, if significant, indicates significant non-normality in data • Analyze Descriptive Statistics Explore • Click on “Plots”, make sure “Normality Plots w/Tests” is checked
Testing Assumptions • Homogeneity of Variances (Homoscedasticity) • Tested at the same time you test ANOVA • Analyze Compare Means One-Way ANOVA • Click on “Options” and make sure “Homogeneity of variance test” is checked • If violated, use Brown-Forsythe or Welch statistics, which do not assume homoscedasticity
Method #1: Compare Means • One-Way ANOVA • Analyze Compare Means One-Way ANOVA • “Dependent List” = DV’s; “Factor” = IV • Options • Descriptive • Fixed and random effects • Homogeneity of variance test • Levene’s Test: Significant result Non-homogenous variances • Brown-Forsythe • Welch • Means plot
Method #1: Compare Means • One-Way ANOVA • Post-Hoc • Can only be done if your IV has 3+ levels • Pointless if only 2 levels, just look @ the means • Click the test you want, either with equal variances assumed or not assumed • DON’T just click all of them and see which one gives what you want (that’s cheating), select the test you want priori
Method #1: Compare Means • Contrasts • Click “Polynomial”, Leave “Degree” at default (“Linear”) • Enter in your coefficients • # of coefficients should equal # of levels of your IV • Doesn’t count missing cells, so if you have 3 levels, but no one in one of the levels, you should have 2 coefficients • Coefficients need to sum to 0
Method #1: Compare Means • Contrasts • Enter in your coefficients • IV = Race – 1=Caucasian, 2=African American, 3=Asian American, 4=Hispanic, 5=Native American, 6=Other, BUT there were no Native Americans in the sample • If you want to compare Caucasians to “Other”, coefficients = 1, 0, 0, 0, -1 • Caucasians vs. everyone else = -1, .25, .25, .25, .25
Method #2: Univariate • Univariate works for both one-way (1 IV) and factorial ANOVA’s (2+ IV’s) • Allows for specification of both fixed and random factors (IV’s) • Assumptions • Independence of Observations • Normally Distributed Data • Both same as one-way ANOVA
Factorial ANOVA • Assumptions: • Homoscedasticity • Tested at the same time you test ANOVA • Click on Analyze General Linear Model Univariate • Click on “Options” and make sure “Homogeneity tests” is checked
Factorial ANOVA • Options • Estimated Marginal Means • Displays means, SD’s, & CI’s for each level of each IV selected • If “Compare main effects” is checked, works as one-way ANOVA on each IV selected • “Confidence interval adjustments” allows you to correct for inflation of alpha using Bonferroni or Sidak method • Descriptive statistics • Estimates of effect size • Observed power • Pointless, adds nothing to interpretation of p-value and e.s. • Homogeneity tests • Levene’s test
Factorial ANOVA • Save • Don’t worry about this for now • Post Hoc • Select the IV for which you wish to compare all levels against all other levels (i.e. that you don’t plan to do planned comparisons on) • Click on the right arrow button so the IV is in the box labeled “Post Hoc Tests for” • Check the post hoc tests you want done, either with equal variances assumed or not assumed • Click “Continue”
Factorial ANOVA • Plots • Horizontal Axis • What IV is on the x-axis • Separate Lines • Separate Plots
Factorial ANOVA • The following graph has the IV “Race” on the horizontal axis and separate lines by the IV “Gender”
Factorial ANOVA • Model • Allows you to: • Denote which main effects and interactions you are interested in testing (default is to test ALL of them) • Specify which type of sum of squares to use • Usually you won’t be tinkering with this
Factorial ANOVA • Contrasts • Tests all levels within one IV • Concern yourself with Simple only for now • “Reference category” = What level all others are compared to (either first or last, with this referring to how they were numbered) • Can test specific levels within one IV with specific levels in another IV, but requires knowledge of syntax
Factorial ANOVA • Interpreting interactions • See graphs