Download
1 / 24
240 likes | 281 Views
1. Give the domain and range of the relation. Unit 4 Review. 2. Give the domain and range of the relation. Unit 4 Review. 3. Give the domain and range of the relation. Unit 4 Review. Give the domain and range of the relation. Tell whether the relation is a function. Unit 4 Review.

E N D
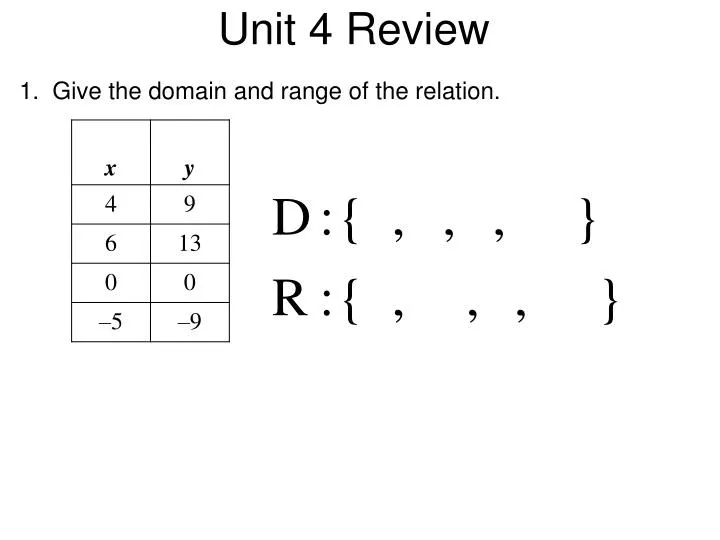
1. Give the domain and range of the relation. Unit 4 Review
2. Give the domain and range of the relation. Unit 4 Review
3. Give the domain and range of the relation. Unit 4 Review
Give the domain and range of the relation. Tell whether the • relation is a function. Unit 4 Review
5. Give the domain and range of the relation. Tell whether the relation is a function. Unit 4 Review
6. Identify the independent and dependent variables in the situation. The amount of electricity used for air conditioning in homes increases as the temperature increases. Unit 4 Review Independent: temperature; Dependent: amount of electricity used
7. Identify the independent and dependent variables in the situation. Then, write a rule in function notation for the situation. A video club costs $25 to join. Each video that is rented costs $2.50. Let v represent the number of videos. Unit 4 Review Independent: # of videos; Dependent: cost
10. Data was collected on the average winter temperature and the number of days with snow of a random group of cities in the United States. Identify the correlation you would expect to see between the average winter temperature and the number of days with snow. Unit 4 Review
11. Choose the scatter plot that best represents the relationship between the number of students who passed the final exam and the number of students who failed the class. Explain your answer. Unit 4 Review
12. The scatter plot shows the relationship between the weekly total sales ($) and the number of different rug designs a rug store has. Based on this relationship, predict what the total sales will be when the store has 110 different rug designs. Unit 4 Review
13. Which situation best describes a positive correlation? Unit 4 Review
14. Determine whether the sequence appears to be an arithmetic sequence. If so, find the common difference and the next three terms in the sequence. Unit 4 Review –5, –11, –17, –23, –29, . . .
15. Find the 20th term in the arithmetic sequence –4, 1, 6, 11, 16,... Unit 4 Review
16. Sylvie is going on vacation. She has already driven 60 miles in one hour. Her average speed for the rest of the trip is 57 miles per hour. How far will Sylvie have driven in 7 hours? Unit 4 Review
17. Determine a relationship between the x- and y-values. Write an equation. Unit 4 Review
Table x y 18. Express the relation for the math test scoring system {(1, 2), (2, 3), (3, 5), (4, 10), (5, 5)} as a table, as a graph and as a mapping diagram. Unit 4 Review y x
Table x y 19. Graph for the domain D: {–8, –4, 0, 4, 8}. Unit 4 Review
Table x y 20. Graph the function . Unit 4 Review
Table x y 21. The function describes how far from home Shu Ling is as she drives from Dallas to Miami. Graph the function. Use the graph to estimate how far from home Shu Ling is in 12 hours. Unit 4 Review
Table h f(h) 22. The temperature of air in a room that began at F is increasing by F per hour. Write a function that describes the temperature of the air over time. Graph the function to show the temperatures over the first 10 hours. Unit 4 Review
23. Lionel observes that traffic is getting worse and it’s taking him longer to get to work. He records once a week the following data for several weeks. Graph a scatter plot using the given data. Unit 4 Review
24. Graph a scatter plot using the given data. What kind of correlation does the graph show? Unit 4 Review