Download
1 / 13
130 likes | 135 Views
Learn about the Central Limit Theorem and how it applies to sums and averages. Understand the concept of probability histograms and empirical histograms. Examples included.

E N D
Assignment Sheet • Read Chapter 18 • Assignment #11 (Due April 13th) • Chapter 18 • Exercise Set A: 1,2,3,5 • Exercise Set B: 1,6 • Exercise Set C: 2,3,5 • Review Exercises: 1,2,4,5 , 7(which is right), 8,10,11 • Test 2 on Wednesday April 13th over Chapters 13 through 18
Overview • Central Limit Theorem • Intuition • Sums • Averages • Examples
Central Limit Theorem: Sums • For a large number of random draws, with replacement, the distribution of the sum approximately follows the normal distribution • Mean of the normal distribution is • N* (expected value for one repetition) • SD for the sum (SE) is • This holds even if the underlying population is not normally distributed
Central Limit Theorem: Averages • For a large number of random draws, with replacement, the distribution of the average = (sum)/N approximately follows the normal distribution • The mean for this normal distribution is • (expected value for one repetition) • The SD for the average (SE) is • This holds even if the underlying population is not normally distributed
0 1 0 1 0 0 1 Probability Histograms • In a probability histograms, the area of the bar represents the chance of a value happening as a result of the random (chance) process • For many processes, the associated probability histogram can be derived explicitly • Draw two numbers from the box and sum or average them. • For other processes, it may be difficult to explicitly determine the probability histogram • In many of these cases, the CLT indicates that the normal distribution gives a good approximation of the actual probability histogram • Draw 1000 numbers from the box and sum or average them.
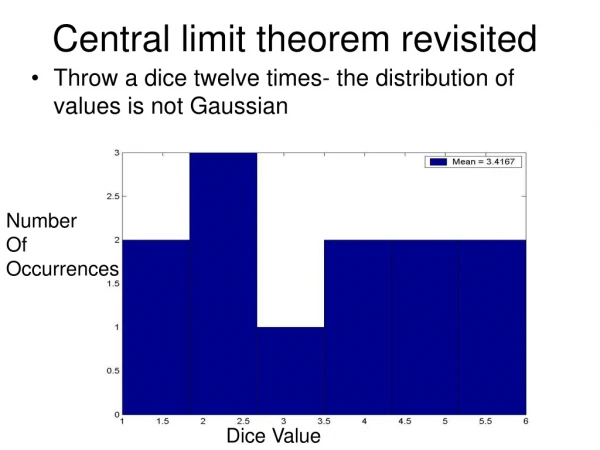
Empirical Histograms • Empirical histograms are histograms based on actually performing an experiment many times • If the experiment is repeated many, many times, then the empirical histogram should be close to the (theoretical) probability histogram
Example: Sums • Flip a fair coin and count the number of heads – 10 flips
Example: Sums • Flip a fair coin and count the number of heads –50 flips
Example: Sums • Flip a fair coin and count the number of heads – 100 flips
Example: Averages • Flip a fair coin and determine the proportion of times heads occurs – 10 flips
Example: Averages • Flip a fair coin and determine the proportion of times heads occurs – 50 flips
Example: Averages • Flip a fair coin and determine the proportion of times heads occurs – 100 flips (Dr. Monticino)