Download
1 / 22
220 likes | 314 Views
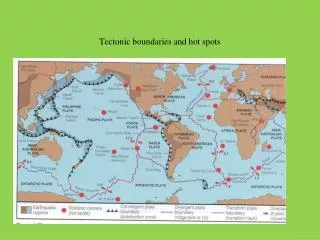
Origin of Ionospheric Hot Spots During Quiet Times. J. Raeder, W. Li Space Science Center, UNH D. Knipp NCAR/HAO MURI/NADIR Workshop, Boulder, CO, October 27, 2010. Introduction. IMF and Solar Wind.

E N D
Origin of Ionospheric Hot Spots During Quiet Times J. Raeder, W. Li Space Science Center, UNH D. Knipp NCAR/HAO MURI/NADIR Workshop, Boulder, CO, October 27, 2010
Introduction IMF and Solar Wind • High Poynting flux into the polar ionosphere is expected during storms = strong southward IMF. • However, there are times when the IMF is not southward (= quiet magnetosphere, Kp<2), but strong, localized Poynting flux is observed. Poynting Flux-DMSP Bx AMIE Joule Heat By Bz |V|
CHAMP Data: Neutral Density Enhancement • The localized energy input has a profound effect on neutral density. DMSP Poynting Flux Northward Turning, SW Density Increase Shock Arrival
The Open Geospace General Circulation Model: • Coupled global magnetosphere - ionosphere - thermosphere model. • 3d Magnetohydrodynamic magnetosphere model. • Coupled with NOAA/SEC 3d dynamic/chemistry ionosphere - thermosphere model (CTIM). • Coupled with inner magnetosphere / ring current models: Rice U. RCM, NASA/GSFC CRCM. • Model runs on demand (>300 so far) provided at the Community Coordinated Modeling Center (CCMC at NASA/GSFC). • http://ccmc.gsfc.nasa.gov/ • Fully parallelized code, real-time capable. Runs on IBM/datastar, IA32/I64 based clusters, PS3 clusters, and other hardware. • Used for basic research, numerical experiments, hypothesis testing, data analysis support, NASA/THEMIS mission support, mission planning, space weather studies, and Numerical Space Weather Forecasting in the future. • Funding from NASA/LWS, NASA/TR&T, NSF/GEM, NSF/ITR, NSF/PetaApps, AF/MURI programs. OpenGGCM: Global Magnetosphere Modeling Aurora Ionosphere Potential Personnel: J. Raeder, D. Larson, W. Li, A. Vapirev, K. Germaschewski, L. Kepko, H.-J. Kim, M. Gilson, B. Larsen (UNH), T. Fuller-Rowell, N. Muriyama (NOAA/SEC), F. Toffoletto, A. Chan, B. Hu (Rice U.), M.-C. Fok (GSFC), A. Richmond, A. Maute (NCAR)
OpenGGCM Simulations of Three Events • These events happen frequently (see afternoon session). • OpenGGCM can reproduce them. • Which allows us to study their causes. 2004 November 7 2005 January 21 2005 August 24
North Polar Cap Distribution of Joule Heating and FACSmall clock angle & large Byz -> large hot spot of JH & FAC -> large Poynting flux Positive FAC is downward +Zgse 23nT +Ygse NH JH: 651 GW; Global: 1161GW DMSP f15 SM Northern Hemisphere
North Polar Cap Distribution of Joule Heating and FACsmall clock angle & small Byz -> small area of enhanced JH & FAC -> small Poynting flux Positive FAC is downward +Zgse 9.4nT +Ygse NH JH: 182 GW; Global: 336GW DMSP f15 AMPERE: Positive FAC is upward AMPERE/Iridium statistical FAC for northeast IMF [Anderson et. Al. 2008]
North Polar Distributions of Joule Heating and FACsmall clock angle & large Byz -> small hot spot; missed by DMSP Positive FAC is downward 22nT +Zgse +Ygse NH JH: 352GW; Global: 717GW DMSP f15 Positive FAC is upward Iridium statistical FAC for northeast IMF [Anderson et. Al. 2008]
North Polar Distributions of Joule Heating and FACHot spot moves in response to IMF clock angle: DMSP missed hot spot Positive FAC is downward Fast Rotating +Zgse +Ygse NH JH: 260GW; Global: 510GW Positive FAC is upward DMSP f15 Iridium statistical FAC for northwest IMF [Anderson et. Al. 2008]
South Polar Distributions of Joule Heating and FACIMF clock angle controls total energy input, |B| is less important. Positive is downward +Zgse 16nT +Ygse SH JH: 992GW; Global: 1611GW DMSP f15
South Polar Distributions of Joule Heating and FAC For ~90o clock angle power input becomes large, but also more spread out; DMSP missed hot spot Positive FAC is downward +Zgse 19nT GSE 90o ≠ GSM 90o IMF may be slightly southward +Ygse SH JH: 708GW; Global: 1604GW DMSP f15 Iridium statistical FAC for dawnward and duskward IMF in north polar [Anderson et. Al. 2008]
North Polar Distributions of Joule Heating and FAC- Brief Southward IMF Positive FAC is downward +Zgse +Ygse 9.7nT NH JH: 543GW; Global: 1226GW Positive FAC is upward DMSP f15 Iridium statistical FAC for southeast IMF [Anderson et. Al. 2008]
South Polar Distributions of Joule Heating and FACBrief Southward IMF: total power input less than during E-W IMF period! Positive FAC is downward +Zgse +Ygse 24nT DMSP f15 SH JH: 661GW; Global: 1065GW Iridium statistical FAC for southward IMF [Anderson et. Al. 2008]
Relation to Cusp Reconnection Field lines traced from SM latitude 80o +Zgse 23nT traced from DMSP and nearby points near SM lat. 70o +Ygse Traced from SM latitude 60o
Relation with Cusp ReconnectionOrigin, evolution, and motion of open field lines, fluid element tracing Newly created open line moving westward Blue field lines traced from SM latitude 80o IMF +Zgse Cyan field lines Traced to R=5RE 23nT +Ygse Path of a fluid element
Relation to Cusp Reconnection Freshly reconnected field lines are dragged east-west: Blue field lines traced from SM latitude 60o +Zgse Southern Hemisphere +Ygse Newly created open line moving eastward Field lines traced from DMSP and nearby points
Field Line Dragging, FACs, and Flow Channels • Mechanical view (V/B, are primary variables): field lines are dragged through the ionosphere, along with ionospheric plasma. Friction between plasma and neutrals causes heating. • Electrical view (J/E are primary variables): reconnection causes B shear FAC resistive closure in the ionosphere Joule heating. • These views are equivalent. E/J easier to observe/compute; V/B more fundamental. From Tanaka 2007
E×B flow channels and FAC Maximum Cross-track E×B (Vy) at dot Clock angle SYM-H Eriksson et.al. 2008 found sunward E×B flow between two adjacent & opposite FACs [Anderson et. Al. 2008]
OpenGGCM/CTIM Neutral Density 2005 January 21 16:00 – 21:00 UT Northern Hemisphere
CTIM Neutral Density: latitude versus time 00:00 LT 03:00 LT 06:00 LT 09:00 LT 12:00 LT 15:00 LT 18:00 LT 21:00 LT 2005 January 21 16:00 – 21:00 UT
Summary • Strong Joule heating is unexpectedly observed in the dayside high latitude region between 60o (-60o) and 80o (-80o) SM latitude in the Northern (Southern) Hemisphere for northward IMF conditions. • These “hot spots” extend from noon to dawn (dusk) for positive (negative) IMF By in the Northern Hemisphere, and extends to an opposite direction in the Southern Hemisphere. • Total energy input correlates with IMF clock angle and often exceeds energy deposition during southward IMF (storm main phase). • A stronger IMF or a higher solar wind speed may also lead to increased Joule heating. • The “hot spots” are sandwiched by two adjacent and opposite high-latitude FACs. • For northern and southern hemispheres, downward FAC locates equatorward (poleward) of upward FAC with respect to the “hot spot” in the afternoon (morning) sector. • Open field lines created by cusp reconnection drive drive the FAC that dissipates in the ionosphere and creates the hot spots. • OpenGGCM has reproduced observed PF and Joule heating in several cases. • A new NSF/GEM challenge is planned to test the fidelity of these predictions.
South Polar Distributions of Joule Heating and FACBig clock angle & big Byz -> large hot area of JH & FAC -> large Poynting flux Positive is downward FAC 45nT +Zgse +Ygse SH JH: 488GW; Global: 964GW DMSP f15