Download
1 / 23
240 likes | 263 Views
Chapter 9: Weather Forecasting. Acquisition of weather information Weather forecasting tools Weather forecasting methods Weather forecasting using surface charts. Acquisition of Weather Information. World Meteorological Organization National Centers for Environmental Prediction

E N D
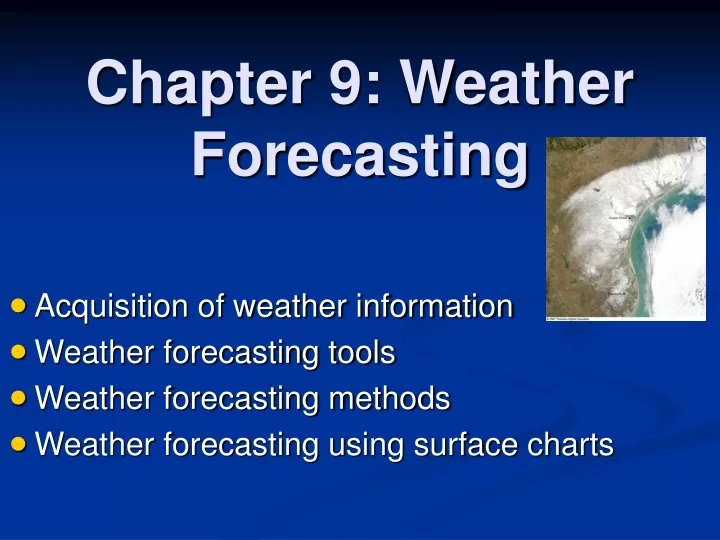
Chapter 9: Weather Forecasting • Acquisition of weather information • Weather forecasting tools • Weather forecasting methods • Weather forecasting using surface charts
Acquisition of Weather Information • World Meteorological Organization • National Centers for Environmental Prediction • Watches:favorable condition for potential hazardous weather; what you need to do: pay attention • Warnings:hazardous weather is imminent or actually occurring; what you need to do: take action • Advisories:like warning but for less hazardous weather, what you need to do: take action if necessary • The internet plays a crucial role in the global communication of weather information. • Go to: http://www.weather.gov
Weather Forecasting Tools • AWIPS: Advanced Weather Interactive Processing System used by forecasters and can process satellite, radar, surface observation, radiosonde data and weather forecasting model output • Sounding Meteorgram Q1: Is there fog based on the sounding? a) yes, b) no
Near Orlando, FL Hail size > 3 inch 100% probability Fig. 9-1, p. 238
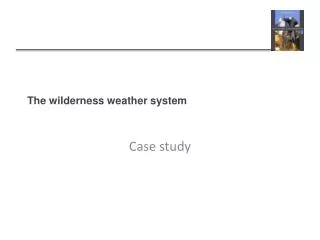
Satellites and Weather Forecasting • geostationary satellites • polar orbiting satellites • Geostationary Operational Environmental Satellite (GOES) • infrared images: estimate height; 3-D image • visible images: not useful at night • water vapor images: particularly useful for clear sky • Satellite sounder data of temperature and humidity Q2: Can a geostationary satellite cover polar regions? a) yes, b) no Q3: Can a polar-orbiting satellite cover the whole earth? a) yes, b) no
Cannot see polar areas; 36,000 km above equator; Same speed as earth’s rotation 850 km above surface; nearly follow the meridion; cover the whole earth Fig. 9-5, p. 240
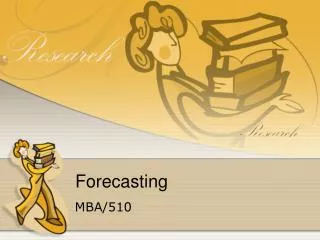
Visible Infrared Enhanced Infrared Fig. 9-9a, p. 242
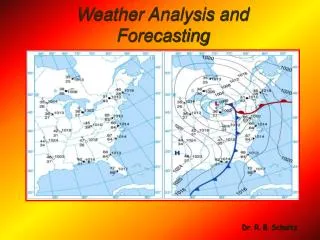
The Computer and Weather Forecasting: Numerical Weather Prediction • Analysis: final chart using available data • numerical weather prediction (NWP): based on computer models • atmospheric models: fluid dynamics and atmospheric physics • Progs: prosnostic chart for weather forecast • One of the world’s first computers was built for thespecific purpose of performing weather forecasts.
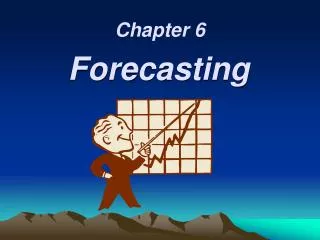
48-hr NWP forecast of 500 mb height 12km vs 60km grid spacing Q4: which forecasting is overall better? a) 12 km regional model; b) 60 km global model analysis Fig. 9-12a, p. 245
Why NWS Forecasts go Awry and Steps to Improve Them • grid spacing: models cannot resolve features within a grid cell (e.g., 40 km for global models) • incomplete data coverage (e.g., over remote regions) • model deficiencies due to subgrid processes (e.g., clouds, land surface) • Chaos: weather forecasts are highly sensitive to our ability to observe the weather. Since it is impossible to observe the weather at all places at all times, weather forecasts will never be perfect. This is the reason that we cannot predict the weather 1 month or 1 year from the forecasting day. Q5: For global model with grid spacing of 40 km, can you see the Mt. Lemmon or Tucson in the model? a) yes, b) no
Why NWS Forecasts go Awry and Steps to Improve Them • ensemble forecasting: spaghetti plot to indicate the robustness of forecast Q6: where do you have more confidence in the forecasting? a) Northeastern Pacific b) Northwestern Atlantic
Other Forecasting Methods • persistence forecast: using current state to predict future; not bad for Tucson in June • trend forecast: assuming constant change rate • analogue method: search for similar chart in history • statistical forecast: routinely used; Model Output Statistics (MOS)--correct known model errors • probability forecast: particularly for precipitation • climatological forecast: using climatology to predict future; good for Tucson rainfall in June
Q7: What does it mean by `chance of rain is 50% for one area’? a) It will rain over 50% of the area b) 50% chance that rainfall will not occur in the whole area c) 50% change that any random location in the area will receive measurable rainfall in the given period Table 9-1, p. 249
Probability for a `white Christmas’ – 1 inch or more of snow Q8: The probability for a white Christmas is 20% in Northern Arizona. It means a white Christmas would occur: a) Once every 5 years, b) once every 20 years
Types of Forecasts • very short range forecast or nowcast: 0-6 hr • short range forecast: 6 hr – 3 days • Medium-range (or extended) forecast: 3-8.5 days • long range forecast: 8.5 days – 2 weeks • Monthly and seasonal outlooks: above, near, or below normal conditions • Long-range forecasts are less specific than short range forecasts.
Using your intuitive understanding of color to answer the two questions below: Q9: Precipitation outlook (left panel) for Arizona is a) above normal, b) near normal, c) above normal Q10: Temperature outlook (right panel) for Arizona is a) above normal, b) near normal, c) above normal
Accuracy and Skill in Forecasting Forecasts show skill only when they are more accurate than a straightforward forecast (e.g., only using persistence or climatology) • Both persistence and climatology are surprisinglyaccurate forecasting methods sometimes. Q11: If you forecast clear sky for the next three days in mid-June for Tucson, and those forecasts turn out to be accurate. Does it means that your forecasts have skill? a) absolutely yes, b) absolutely no, c) not necessarily yes Q12: Do we have forecasting skills in predicting the weather at noon 2 weeks from the forecasting day? a) yes, b) no
Predicting the Weather from Local Signs • Halo:`a halo around the moon portends rain’ (foldlore) • To see a halo: block out the sun with your hand and look at the cirrostratus clouds. Wear polarized sunglasses if possible. Use typical changes of wind, T, Td, clouds, and precipitation associated with warm fronts
Use typical changes of wind, T, Td, clouds, and precipitation associated with warm fronts Using information related to longwave cooling to predict nighttime temperature: Q13: if you predict a clear and dry night, the nighttime temperature would be: a) relatively cold; b) relatively warm Q14: if you predict cloudy night, the nighttime temperature would be: a) relatively cold; b) relatively warm
Determining the Movement of Weather Systems • forecasting rules of thumb: surface pressure systems tend to move in the same direction as the 500 mb wind; the speed at which surface systems move is about half the wind speed at 500 mb • using the surface chart • Internet now provides much of the weather information • http://www.weather.gov • http://www.atmo.arizona.edu • http://www.wrh.noaa.gov/twc
Current front and front 6 hr ago 500 mb height Estimate for the next 24 hr observation for 24 hr later Fig. 9-20, p. 256