Download
1 / 1
10 likes | 181 Views
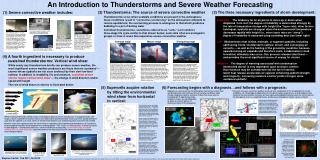
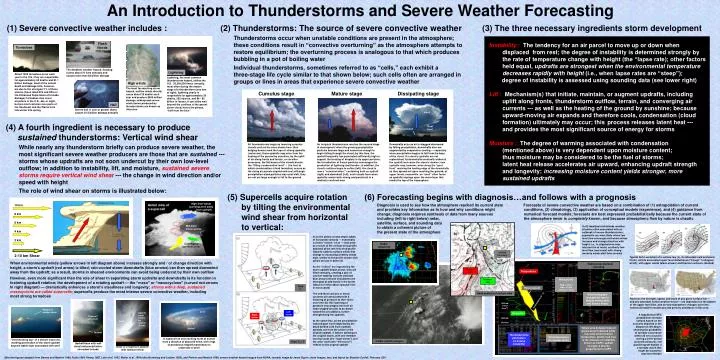
An Introduction to Thunderstorms and Severe Weather Forecasting. L. L. Tornadoes. L. Flash floods. Lightning. The deadliest weather hazard, flooding claims about 70 lives annually and causes more than $5 billion damage.

E N D
An Introduction to Thunderstorms and Severe Weather Forecasting L L Tornadoes L Flash floods Lightning The deadliest weather hazard, flooding claims about 70 lives annually and causes more than $5 billion damage About 1200 tornadoes occur each year in the U.S.; they are responsible for approximately 60 deaths and $1.1 billion damage; most of the annual death and damage tolls, however, are due to the strongest 1% of these storms (those rated EF4 and EF5 on the Enhanced Fujita Scale of tornado damage); tornadoes may occur anywhere in the U.S., day or night, but are most common over parts of the Southeast and the Plains from late winter into spring Lightning, the most common thunderstorm hazard, strikes the U.S. 20,000,000 times annually, most often during the mature stage of a thunderstorm (see box at right); lightning yearly is responsible for approximately 30 deaths, 250 injuries, and $4 - $5 billion in losses; it can strike well beyond the confines of the parent storm cloud, hence the phrase, “bolt from the blue” High winds The most far-reaching storm hazard, outflow winds directly cause about 25 deaths each year and produce $500 million damage; widespread severe wind storms produced by thunderstorms are known as derechos Cumulus stage Mature stage Dissipating stage Hail Severe hail (1 inch or greater diam.) causes $1.5 billion damage annually Anvil Gust front Precipitation All thunderstorms begin as towering cumulus clouds such as the ones shown here; their bulging domes mark the tops of strong updrafts (red arrow); these updrafts may arise from the heating of the ground by sunshine, by the uplift of air along fronts and terrain, or via other processes; the flat bases of the clouds denote the “lifting condensation level” – the level at which condensation (cloud formation) occurs as the rising air parcels expand and cool; although precipitation-sized particles may exist aloft, they are not yet large enough to fall to the ground An incipient thunderstorm reaches the second stage of development when the growing precipitation particles become large and numerous enough to begin falling through the cloud; by this time, the updraft frequently has penetrated sufficiently high to support the freezing of droplets in its upper portions; the introduction of frozen particles encourages the production of lightning and thunder; in addition, the cloud’s outlines begin to soften (left); the cloud is now a “cumulonimbus,” containing both an updraft (right) and downdraft (left); such clouds form when updrafts remain both strong and persistent in a relatively confined area Downdrafts arise as air is dragged downward by falling precipitation; downdrafts also are augmented by evaporative cooling --- especially when precipitation begins to fall from the base of the cloud; if a storm’s updrafts are not replenished, its downdrafts eventually undercut the updraft and cause the storm’s demise; new updrafts may, however, arise along the “gust front” marking the leading edge of the downdrafts as they spread out upon reaching the ground; at upper levels, meanwhile, an “anvil” often forms as updrafts impinge upon the warm layer that marks the top of the troposphere 10 km 8 km High-level winds (carrying anvil away from updraft) Aerial view of a supercell 6 km (Left) Idealized mid-latitude weather situation often associated with an outbreak of severe thunderstorms; supercells are most likely where low level flow converges and where winds increase and change direction with height; i.e., in stippled area near intersection of moist, southerly low- level flow (red arrow) with strong westerly winds aloft (blue arrows) 4 km In (a) the yellow arrows depict tubes of horizontal vorticity --- essentially invisible “rollers” of air --- that arise as a result of the vertical wind profile depicted at the left; this wind profile features easterly surface winds that change to increasing westerly winds aloft, similar to the profile shown with yellow arrows in panel (4) As the “rollers” are ingested by the storm updraft (black arrow), they are tilted vertically, creating a pair of counter-rotating vortices (red and blue arrows) whose circulations are strongest at mid-levels in the storm (about 2-3 miles above ground level in most cases) The mid-level vortices or meso-cyclones are associated with a lowering of pressure at their level; over time (b), this lowering of pressure encourages low level air (tube-shaped arrows) to be drawn toward the circulations, further strengthening the updrafts At the same time, as the precipitation-induced gust front (depicted by the black-barbed cold front symbol) spreads out from the center of the original updraft, it fosters splitting of the original storm, with one member moving south (the “right-mover”) and the other north (the “left-mover”) relative to the original updraft 2 km Mid-level mesocyclone Radar reflectivity Outflow boundary 2-10 km Shear Typical 36-hr evolution of a surface low (L), its attendant cold and warm fronts, and its associated upper level disturbance (“trough” in diagram at left), with upper winds (black arrows) and thermal contours (dashed) Converging low-level winds Radiosonde (balloon) sounding Thermal axis Temperature Wind profile Flag = 50 kts Bar = 10 kts Half bar = 5 kts Moisture axis Time To Parcel ascent L L Hand analysis of surface data Wind hodograph (a graphical way to display wind profile and assess shear) However, the strength, speed, and track of any given surface low --- and any attendant severe weather threat --- are dependent on the pattern of the upper level flow, and on how that pattern changes over time; numerical model forecasts provide primary assistance in this area Temperature (0 o C) 500 mb (“mid- level”) Shadow of another storm Left- mover Dewpoint Anvil Updraft tower hidden by laminar clouds Right-mover Moisture 850 mb “Pedestal” wall cloud Anvil Surface Yellow area between trace of parcel ascent (dashed white line) and environmental temperature profile (red line) is the measure of instability known as CAPE; updraft strength is directly proportional to CAPE Updraft Thermodynamic parameters (to assess instability) Tornado Wind parameters (to assess shear) A supercell as seen looking north at sunset from a distance of about 60 miles, with rings of pendulous-shaped mammatus on underside of anvil “Overshooting top” of a distant supercell, marking penetration of the storm updraft beyond stable layer associated with anvil Visible satellite imagery Time To + T Updraft base with wall cloud and precipitation-shrouded tornado Base of a supercell updraft with laminar inflow (2) Thunderstorms: The source of severe convective weather Thunderstorms occur when unstable conditions are present in the atmosphere; these conditions result in “convective overturning” as the atmosphere attempts to restore equilibrium; the overturning process is analogous to that which produces bubbling in a pot of boiling water Individual thunderstorms, sometimes referred to as “cells,” each exhibit a three-stage life cycle similar to that shown below; such cells often are arranged in groups or lines in areas that experience severe convective weather • The three necessary ingredients storm development (1) Severe convective weather includes : Instability : The tendency for an air parcel to move up or down when displaced from rest; the degree of instability is determined strongly by the rate of temperature change with height (the “lapse rate); other factors held equal, updrafts are strongest when the environmental temperature decreases rapidly with height (i.e., when lapse rates are “steep”); degree of instability is assessed using sounding data (see lower right) Lift : Mechanism(s) that initiate, maintain, or augment updrafts, including uplift along fronts, thunderstorm outflow, terrain, and converging air currents --- as well as the heating of the ground by sunshine; because upward-moving air expands and therefore cools, condensation (cloud formation) ultimately may occur; this process releases latent heat --- and provides the most significant source of energy for storms Moisture : The degree of warming associated with condensation (mentioned above) is very dependent upon moisture content; thus moisture may be considered to be the fuel of storms; latent heat release accelerates air upward, enhancing updraft strength and longevity; increasing moisture content yields stronger, more sustained updrafts (4) A fourth ingredient is necessary to produce sustained thunderstorms: Vertical wind shear While nearly any thunderstorm briefly can produce severe weather, the most significant severe weather producers are those that are sustained --- storms whose updrafts are not soon undercut by their own low-level outflow; in addition to instability, lift, and moisture, sustained severe storms require vertical wind shear --- the change in wind direction and/or speed with height The role of wind shear on storms is illustrated below: (6) Forecasting begins with diagnosis…and follows with a prognosis • Supercells acquire rotation • by tilting the environmental • wind shear from horizontal • to vertical: Diagnosis is used to see how the atmosphere reached its current state and provides key information as to how and why conditions might change; diagnosis requires synthesis of data from many sources including (left to right below) radar, satellite, surface, and sounding data to obtain a coherent picture of the present state of the atmosphere Forecasts of severe convective weather are based on a combination of (1) extrapolation of current conditions, (2) climatology, (3) application of conceptual models (experience), and (4) guidance from numerical forecast models; forecasts are best expressed probabilistically because the current state of the atmosphere never is completely known, and because atmospheric flow by nature is chaotic When environmental winds (yellow arrows in left diagram above) increase strongly and / or change direction with height, a storm’s updraft (red arrow) is tilted; rain-cooled storm downdrafts (blue arrows) can then spread downwind away from the updraft; as a result, storms in sheared environments can avoid being undercut by their own outflow However, even more significant than the role of shear in separating storm updrafts and downdrafts is its function in fostering updraft rotation; the development of a rotating updraft --- the “meso” or “mesocyclone” (curved red arrows In right diagram) --- dramatically enhances a storm’s steadiness and longevity; storms with a deep, sustained mesocyclone are called supercells; supercells produce the most intense severe convective weather, including most strong tornadoes A hypothetical SPC probabilistic tornado outlook based on the scenario depicted in the diagram at left above, showing the probability of tornado occurrence within 25 nm of a point during a 24-hr period (colored contours); red parallelogram depicts a a tornado watch that might be issued for near-term threats Selected figures adapted from Barnes and Newton 1986, Fujita 1964, Klemp 1987, Lehr et al. 1957, Moller et al. 1994 (after Browning and Ludlam 1962), and Palmén and Newton 1969; severe weather hazard images from NOAA; tornado image by Jared Guyer; cloud images, text, and layout by Stephen Corfidi, February 2011